
Statistics Through Applications
2nd Edition
ISBN: 9781429219747
Author: Daren S. Starnes, David Moore, Dan Yates
Publisher: Macmillan Higher Education
expand_more
expand_more
format_list_bulleted
Concept explainers
Videos
Question
Chapter 1.2, Problem 1.25E
To determine
To identify wrong in picture.
Expert Solution & Answer
Answer to Problem 1.25E
There are double percent mentioned on Y-axis.
Explanation of Solution
Given:
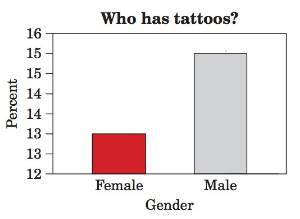
For most of the bar graph, percent of Y-axis shows from zero. But in this picture, it shows from 12. Also, there are double percent shows for 13,14 and 15% which is wrong in the picture.
Chapter 1 Solutions
Statistics Through Applications
Ch. 1.1 - Prob. 1.1ECh. 1.1 - Prob. 1.2ECh. 1.1 - Prob. 1.3ECh. 1.1 - Prob. 1.4ECh. 1.1 - Prob. 1.5ECh. 1.1 - Prob. 1.6ECh. 1.1 - Prob. 1.7ECh. 1.1 - Prob. 1.8ECh. 1.1 - Prob. 1.9ECh. 1.1 - Prob. 1.10E
Ch. 1.1 - Prob. 1.11ECh. 1.1 - Prob. 1.13ECh. 1.1 - Prob. 1.14ECh. 1.1 - Prob. 1.15ECh. 1.1 - Prob. 1.16ECh. 1.1 - Prob. 1.18ECh. 1.1 - Prob. 1.19ECh. 1.1 - Prob. 1.20ECh. 1.1 - Prob. 1.21ECh. 1.1 - Prob. 1.22ECh. 1.1 - Prob. 1.23ECh. 1.1 - Prob. 1.24ECh. 1.2 - Prob. 1.25ECh. 1.2 - Prob. 1.26ECh. 1.2 - Prob. 1.27ECh. 1.2 - Prob. 1.28ECh. 1.2 - Prob. 1.29ECh. 1.2 - Prob. 1.30ECh. 1.2 - Prob. 1.31ECh. 1.2 - Prob. 1.32ECh. 1.2 - Prob. 1.33ECh. 1.2 - Prob. 1.34ECh. 1.2 - Prob. 1.35ECh. 1 - Prob. 1.37RECh. 1 - Prob. 1.38RECh. 1 - Prob. 1.39RECh. 1 - Prob. 1.40RECh. 1 - Prob. 1.41RECh. 1 - Prob. 1.42RECh. 1 - Prob. 1.43RE
Additional Math Textbook Solutions
Find more solutions based on key concepts
Repeated linear factors Evaluate the following integrals. 29. 11x(x+3)2dx
Calculus: Early Transcendentals (2nd Edition)
Sampling Method. In Exercises 9-12, determine whether the sampling method appears to be sound or is flawed.
9. ...
Elementary Statistics
The following set of data is from sample of n=5: a. Compute the mean, median, and mode. b. Compute the range, v...
Basic Business Statistics, Student Value Edition
In Exercises 3–6, write a in the form a = aTT + aNN at the given value of t without finding T and N.
3.
University Calculus: Early Transcendentals (4th Edition)
TRY IT YOURSELF 1
Find the mean of the points scored by the 51 winning teams listed on page 39.
Elementary Statistics: Picturing the World (7th Edition)
Knowledge Booster


Learn more about
Need a deep-dive on the concept behind this application? Look no further. Learn more about this topic, statistics and related others by exploring similar questions and additional content below.Similar questions
- A retail store manager claims that the average daily sales of the store are $1,500. You aim to test whether the actual average daily sales differ significantly from this claimed value. You can provide your answer by inserting a text box and the answer must include: Null hypothesis, Alternative hypothesis, Show answer (output table/summary table), and Conclusion based on the P value. Showing the calculation is a must. If calculation is missing,so please provide a step by step on the answers Numerical answers in the yellow cellsarrow_forwardShow all workarrow_forwardShow all workarrow_forward
- please find the answers for the yellows boxes using the information and the picture belowarrow_forwardA marketing agency wants to determine whether different advertising platforms generate significantly different levels of customer engagement. The agency measures the average number of daily clicks on ads for three platforms: Social Media, Search Engines, and Email Campaigns. The agency collects data on daily clicks for each platform over a 10-day period and wants to test whether there is a statistically significant difference in the mean number of daily clicks among these platforms. Conduct ANOVA test. You can provide your answer by inserting a text box and the answer must include: also please provide a step by on getting the answers in excel Null hypothesis, Alternative hypothesis, Show answer (output table/summary table), and Conclusion based on the P value.arrow_forwardA company found that the daily sales revenue of its flagship product follows a normal distribution with a mean of $4500 and a standard deviation of $450. The company defines a "high-sales day" that is, any day with sales exceeding $4800. please provide a step by step on how to get the answers Q: What percentage of days can the company expect to have "high-sales days" or sales greater than $4800? Q: What is the sales revenue threshold for the bottom 10% of days? (please note that 10% refers to the probability/area under bell curve towards the lower tail of bell curve) Provide answers in the yellow cellsarrow_forward
arrow_back_ios
SEE MORE QUESTIONS
arrow_forward_ios
Recommended textbooks for you
 MATLAB: An Introduction with ApplicationsStatisticsISBN:9781119256830Author:Amos GilatPublisher:John Wiley & Sons Inc
 Probability and Statistics for Engineering and th...StatisticsISBN:9781305251809Author:Jay L. DevorePublisher:Cengage Learning
 Statistics for The Behavioral Sciences (MindTap C...StatisticsISBN:9781305504912Author:Frederick J Gravetter, Larry B. WallnauPublisher:Cengage Learning
 Elementary Statistics: Picturing the World (7th E...StatisticsISBN:9780134683416Author:Ron Larson, Betsy FarberPublisher:PEARSON
 The Basic Practice of StatisticsStatisticsISBN:9781319042578Author:David S. Moore, William I. Notz, Michael A. FlignerPublisher:W. H. Freeman
 Introduction to the Practice of StatisticsStatisticsISBN:9781319013387Author:David S. Moore, George P. McCabe, Bruce A. CraigPublisher:W. H. Freeman
MATLAB: An Introduction with Applications
Statistics
ISBN:9781119256830
Author:Amos Gilat
Publisher:John Wiley & Sons Inc
Probability and Statistics for Engineering and th...
Statistics
ISBN:9781305251809
Author:Jay L. Devore
Publisher:Cengage Learning
Statistics for The Behavioral Sciences (MindTap C...
Statistics
ISBN:9781305504912
Author:Frederick J Gravetter, Larry B. Wallnau
Publisher:Cengage Learning
Elementary Statistics: Picturing the World (7th E...
Statistics
ISBN:9780134683416
Author:Ron Larson, Betsy Farber
Publisher:PEARSON
The Basic Practice of Statistics
Statistics
ISBN:9781319042578
Author:David S. Moore, William I. Notz, Michael A. Fligner
Publisher:W. H. Freeman
Introduction to the Practice of Statistics
Statistics
ISBN:9781319013387
Author:David S. Moore, George P. McCabe, Bruce A. Craig
Publisher:W. H. Freeman
Which is the best chart: Selecting among 14 types of charts Part II; Author: 365 Data Science;https://www.youtube.com/watch?v=qGaIB-bRn-A;License: Standard YouTube License, CC-BY