ORGANIC CHEMISTRY
9th Edition
ISBN: 9780134645704
Author: WADE AND SIMEK
Publisher: PEARSON
expand_more
expand_more
format_list_bulleted
Concept explainers
Videos
Textbook Question
Chapter 12, Problem 12.24SP
covered a synthesis of
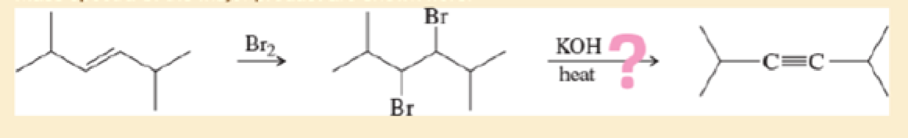
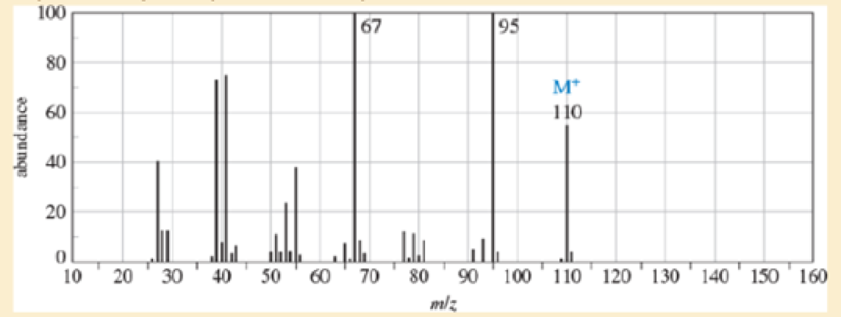
- a. Do the spectra confirm the right product? If not, what is it?
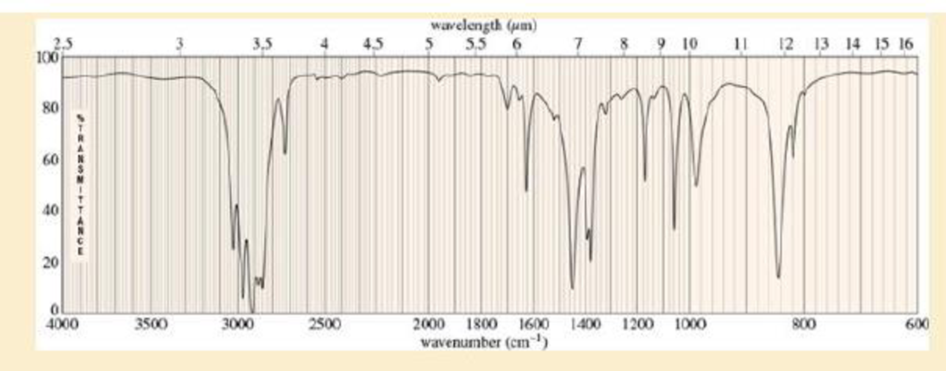
- b. Explain the important peaks in the IR spectrum.
Expert Solution & Answer

Trending nowThis is a popular solution!

Students have asked these similar questions
pressure (atm)
3
The pressure on a sample of pure X held at 47. °C and 0.88 atm is increased until the sample condenses. The pressure is then held constant and the
temperature is decreased by 82. °C. On the phase diagram below draw a path that shows this set of changes.
0
0
200
temperature (K)
400
а
er your payment details | bar xb Home | bartleby
x +
aleksogi/x/isl.exe/1o u-lgNskr7j8P3jH-1Qs_pBanHhviTCeeBZbufuBYT0Hz7m7D3ZcW81NC1d8Kzb4srFik1OUFhKMUXzhGpw7k1
O States of Matter
Sketching a described thermodynamic change on a phase diagram
0/5
The pressure on a sample of pure X held at 47. °C and 0.88 atm is increased until the sample condenses. The pressure is then held constant and the
temperature is decreased by 82. °C. On the phase diagram below draw a path that shows this set of changes.
pressure (atm)
1
3-
0-
0
200
Explanation
Check
temperature (K)
400
X
Q Search
L
G
2025 McGraw Hill LLC. All Rights Reserved Terms of Use Privacy Ce
5.
Chapter 12 Solutions
ORGANIC CHEMISTRY
Ch. 12.3 - Complete the following conversion table. (cm1)...Ch. 12.5 - Which of the bonds shown in red are expected to...Ch. 12.7C - For each hydrocarbon spectrum, determine whether...Ch. 12.9A - Spectra are given for three compounds. Each...Ch. 12.10 - The infrared spectra for three compounds are...Ch. 12.12 - Prob. 12.6PCh. 12.14B - Identify which of these four mass spectra indicate...Ch. 12.15A - Show the fragmentation that accounts for the...Ch. 12.15A - Show the fragmentations that give rise to the...Ch. 12.15B - Ethers are not easily differentiated by their...
Ch. 12.15C - Prob. 12.11PCh. 12 - Prob. 12.12SPCh. 12 - Prob. 12.13SPCh. 12 - All of the following compounds absorb infrared...Ch. 12 - Prob. 12.15SPCh. 12 - Four infrared spectra are shown, corresponding to...Ch. 12 - Predict the masses and the structures of the most...Ch. 12 - Prob. 12.18SPCh. 12 - Prob. 12.19SPCh. 12 - (A true story) While organizing the undergraduate...Ch. 12 - Prob. 12.21SPCh. 12 - Prob. 12.22SPCh. 12 - An unknown, foul-smelling hydrocarbon gives the...Ch. 12 - covered a synthesis of alkynes by a double...Ch. 12 - Three IR spectra are shown, corresponding to three...Ch. 12 - Prob. 12.26SPCh. 12 - Prob. 12.27SPCh. 12 - Prob. 12.28SPCh. 12 - The ultimate test of fluency in MS and IR is...Ch. 12 - Prob. 12.30SPCh. 12 - Consider the following four structures, followed...
Additional Science Textbook Solutions
Find more solutions based on key concepts
Describe the role and impact of microbes on the earth.
Microbiology Fundamentals: A Clinical Approach
Give the IUPAC name for each compound.
Organic Chemistry
2. Define equilibrium population. Outline the conditions that must be met for a population to stay in genetic e...
Biology: Life on Earth (11th Edition)
Define histology.
Fundamentals of Anatomy & Physiology (11th Edition)
To test your knowledge, discuss the following topics with a study partner or in writing ideally from memory. Th...
HUMAN ANATOMY
Choose the best answer to each of the following. Explain your reasoning. If Earth were twice as far as it actua...
Cosmic Perspective Fundamentals
Knowledge Booster


Learn more about
Need a deep-dive on the concept behind this application? Look no further. Learn more about this topic, chemistry and related others by exploring similar questions and additional content below.Similar questions
- 6.arrow_forward0/5 alekscgi/x/sl.exe/1o_u-IgNglkr7j8P3jH-IQs_pBaHhvlTCeeBZbufuBYTi0Hz7m7D3ZcSLEFovsXaorzoFtUs | AbtAURtkqzol 1HRAS286, O States of Matter Sketching a described thermodynamic change on a phase diagram The pressure on a sample of pure X held at 47. °C and 0.88 atm is increased until the sample condenses. The pressure is then held constant and the temperature is decreased by 82. °C. On the phase diagram below draw a path that shows this set of changes. 3 pressure (atm) + 0- 0 5+ 200 temperature (K) 400 Explanation Check X 0+ F3 F4 F5 F6 F7 S 2025 McGraw Hill LLC All Rights Reserved. Terms of Use Privacy Center Accessibility Q Search LUCR + F8 F9 F10 F11 F12 * % & ( 5 6 7 8 9 Y'S Dele Insert PrtSc + Backsarrow_forward5.arrow_forward
- 9arrow_forwardalekscgi/x/lsl.exe/1o_u-IgNslkr7j8P3jH-IQs_pBanHhvlTCeeBZbufu BYTI0Hz7m7D3ZS18w-nDB10538ZsAtmorZoFusYj2Xu9b78gZo- O States of Matter Sketching a described thermodynamic change on a phase diagram 0/5 The pressure on a sample of pure X held at 47. °C and 0.88 atm is increased until the sample condenses. The pressure is then held constant and the temperature is decreased by 82. °C. On the phase diagram below draw a path that shows this set of changes. pressure (atm) 3- 200 temperature (K) Explanation Chick Q Sowncharrow_forward0+ aleksog/x/lsl.exe/1ou-lgNgkr7j8P3H-IQs pBaHhviTCeeBZbufuBYTOHz7m7D3ZStEPTBSB3u9bsp3Da pl19qomOXLhvWbH9wmXW5zm O States of Matter Sketching a described thermodynamic change on a phase diagram 0/5 Gab The temperature on a sample of pure X held at 0.75 atm and -229. °C is increased until the sample sublimes. The temperature is then held constant and the pressure is decreased by 0.50 atm. On the phase diagram below draw a path that shows this set of changes. F3 pressure (atm) 0- 0 200 Explanation temperature (K) Check F4 F5 ☀+ Q Search Chill Will an 9 ENG F6 F7 F8 F9 8 Delete F10 F11 F12 Insert PrtSc 114 d Ararrow_forward
- x + LEKS: Using a phase diagram a X n/alekscgi/x/lsl.exe/10_u-IgNsikr7j8P3jH-IQs_pBan HhvlTCeeBZbufu BYTI0Hz7m7D3ZcHYUt80XL-5alyVpw ○ States of Matter Using a phase diagram to find a phase transition temperature or pressure Use the phase diagram of Substance X below to find the melting point of X when the pressure above the solid is 1.1 atm. pressure (atm) 16 08- solid liquid- 0 200 400 gas 600 temperature (K) Note: your answer must be within 25 °C of the exact answer to be graded correct. × 5arrow_forwardS: Using a phase diagram leksogi/x/sl.exe/1ou-IgNs kr 7j8P3jH-IQs_pBan HhvTCeeBZbufuBYTI0Hz7m7D3ZdHYU+80XL-5alyVp O States of Matter Using a phase diagram to find a phase transition temperature or pressure se the phase diagram of Substance X below to find the boiling point of X when the pressure on the liquid is 1.6 atm. pressure (atm) 32- 16- solid liquid 0. gas 100 200 temperature (K) 300 Note: your answer must be within 12.5 °C of the exact answer to be graded correct. 10 Explanation Check § Q Search J 2025 McGraw Hill LLC. All Rights Researrow_forward151.2 254.8 85.9 199.6 241.4 87.6 242.5 186.4 155.8 257.1 242.9 253.3 256.0 216.6 108.7 239.0 149.7 236.4 152.1 222.7 148.7 278.2 268.7 234.4 262.7 283.2 143.6 QUESTION: Using this group of data on salt reduced tomato sauce concentration readings answer the following questions: 1. 95% Cl Confidence Interval (mmol/L) 2. [Na+] (mg/100 mL) 3. 95% Na+ Confidence Interval (mg/100 mL)arrow_forward
- Results Search Results Best Free Coursehero Unloc xb Success Confirmation of Q x O Google Pas alekscgi/x/lsl.exe/1o_u-IgNslkr 7j8P3jH-IQs_pBanHhvlTCeeBZbufu BYTI0Hz7m7D3ZcHYUt80XL-5alyVpwDXM TEZayFYCavJ17dZtpxbFD0Qggd1J O States of Matter Using a phase diagram to find a phase transition temperature or pressure Gabr 3/5 he pressure above a pure sample of solid Substance X at 101. °C is lowered. At what pressure will the sample sublime? Use the phase diagram of X below to nd your answer. pressure (atm) 24- 12 solid liquid gas 200 400 temperature (K) 600 ote: your answer must be within 0.15 atm of the exact answer to be graded correct. atm Thanation Check © 2025 McGraw Hill LLC. All Rights Reserved. Terms of Use | Privacy Center I Q Search L³ ملةarrow_forward301.7 348.9 193.7 308.6 339.5 160.6 337.7 464.7 223.5 370.5 326.6 327.5 336.1 317.9 203.8 329.8 221.9 331.7 211.7 309.6 223.4 353.7 334.6 305.6 340.0 304.3 244.7 QUESTION: Using this group of data on regular tomato sauce concentration readings answer the following questions: 1. 95% Cl Confidence Interval (mmol/L) 2. [Na+] (mg/100 mL) 3. 95% Na+ Confidence Interval (mg/100 mL)arrow_forwardSearch Results Search Results Best Free Coursehero Unlo x b Success Confirmation of Q aleks.com/alekscgi/x/sl.exe/10_u-lgNslkr7j8P3jH-IQs_pBan HhvlTCeeBZbufu BYTIOHz7m7D3ZcHYUt80XL-5alyVpwDXM TEZayFYCav States of Matter Using a phase diagram to find a phase transition temperature or pressure Use the phase diagram of Substance X below to find the temperature at which X turns to a gas, if the pressure above the solid is 3.7 atm. pressure (atm) 0. 32- 16 solid liquid gas 200 temperature (K) Note: your answer must be within 20 °C of the exact answer to be graded correct. Дос Xarrow_forward
arrow_back_ios
SEE MORE QUESTIONS
arrow_forward_ios
Recommended textbooks for you
 Organic Chemistry: A Guided InquiryChemistryISBN:9780618974122Author:Andrei StraumanisPublisher:Cengage Learning
Organic Chemistry: A Guided Inquiry
Chemistry
ISBN:9780618974122
Author:Andrei Straumanis
Publisher:Cengage Learning
Chapter 4 Alkanes and Cycloalkanes Lesson 2; Author: Linda Hanson;https://www.youtube.com/watch?v=AL_CM_Btef4;License: Standard YouTube License, CC-BY
Chapter 4 Alkanes and Cycloalkanes Lesson 1; Author: Linda Hanson;https://www.youtube.com/watch?v=PPIa6EHJMJw;License: Standard Youtube License