
(a)
To determine: The characteristic infrared absorptions of the
Interpretation: The characteristic infrared absorptions of the functional groups in the given molecule are to be predicted.
Concept introduction: An IR spectrum is a graph for the energy absorbed by a molecule as a function of the frequency or
(a)
Answer to Problem 12.12SP
The characteristic infrared absorptions of the functional groups in the given molecule are,
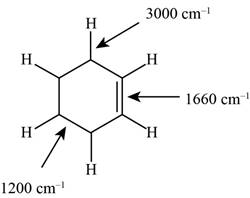
Figure 1
Explanation of Solution
The structure of the given molecule is,

Figure 2
The possibilities of the IR stretching frequencies for the given molecule are shown as,

Figure 1
So, the stretching frequencies of
(b)
To determine: The characteristic infrared absorptions of the functional groups in the given molecule.
Interpretation: The characteristic infrared absorptions of the functional groups in the given molecule are to be predicted.
Concept introduction: An IR spectrum is a graph for the energy absorbed by a molecule as a function of the frequency or wavelength of light. Alkanes, alkenes and alkynes have characteristic
(b)
Answer to Problem 12.12SP
The characteristic infrared absorptions of the functional groups in the given molecule are,

Figure 3
Explanation of Solution
The structure of the given molecule is,
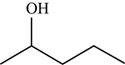
Figure 4
The possibilities of the IR stretching frequencies for the given molecule are shown as,
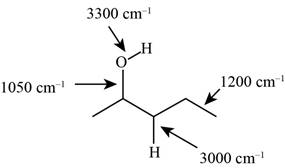
Figure 3
So, the stretching frequencies of
(c)
To determine: The characteristic infrared absorptions of the functional groups in the given molecule.
Interpretation: The characteristic infrared absorptions of the functional groups in the given molecule are to be predicted.
Concept introduction: An IR spectrum is a graph for the energy absorbed by a molecule as a function of the frequency or wavelength of light. Alkanes, alkenes and alkynes have characteristic
(c)
Answer to Problem 12.12SP
The characteristic infrared absorptions of the functional groups in the given molecule are,

Figure 5
Explanation of Solution
The structure of the given molecule is,
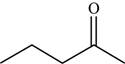
Figure 6
The possibilities of the IR stretching frequencies for the given molecule are shown as,
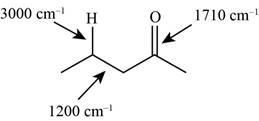
Figure 5
So, the stretching frequencies of
(d)
To determine: The characteristic infrared absorptions of the functional groups in the given molecule.
Interpretation: The characteristic infrared absorptions of the functional groups in the given molecule are to be predicted.
Concept introduction: An IR spectrum is a graph for the energy absorbed by a molecule as a function of the frequency or wavelength of light. Alkanes, alkenes and alkynes have characteristic
(d)
Answer to Problem 12.12SP
The characteristic infrared absorptions of the functional groups in the given molecule are,
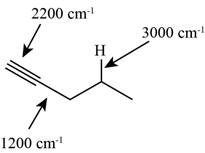
Figure 7
Explanation of Solution
The structure of the given molecule is,
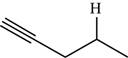
Figure 8
The possibilities of the IR stretching frequencies for the given molecule are shown as,
Figure 7
So, the stretching frequencies of
(e)
To determine: The characteristic infrared absorptions of the functional groups in the given molecule.
Interpretation: The characteristic infrared absorptions of the functional groups in the given molecule are to be predicted.
Concept introduction: An IR spectrum is a graph for the energy absorbed by a molecule as a function of the frequency or wavelength of light. Alkanes, alkenes and alkynes have characteristic
(e)
Answer to Problem 12.12SP
The characteristic infrared absorptions of the functional groups in the given molecule are,
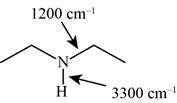
Figure 9
Explanation of Solution
The structure of the given molecule is,
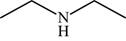
Figure 10
The possibilities of the IR stretching frequencies for the given molecule are shown as,

Figure 9
So, the stretching frequencies of
(f)
To determine: The characteristic infrared absorptions of the functional groups in the given molecule.
Interpretation: The characteristic infrared absorptions of the functional groups in the given molecule is to be predicted.
Concept introduction: An IR spectrum is a graph for the energy absorbed by a molecule as a function of the frequency or wavelength of light. Alkanes, alkenes and alkynes have characteristic
(f)
Answer to Problem 12.12SP
The characteristic infrared absorptions of the functional groups in the given molecule are,
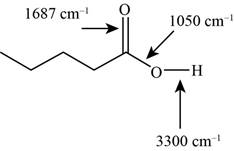
Figure 11
Explanation of Solution
The structure of the given molecule is,
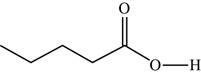
Figure 12
The possibilities of the IR stretching frequencies for the given molecule are shown as,
Figure 11
So, the stretching frequencies of
(g)
To determine: The characteristic infrared absorptions of the functional groups in the given molecule.
Interpretation: The characteristic infrared absorptions of the functional groups in the given molecule are to be predicted.
Concept introduction: An IR spectrum is a graph for the energy absorbed by a molecule as a function of the frequency or wavelength of light. Alkanes, alkenes and alkynes have characteristic
(g)
Answer to Problem 12.12SP
The characteristic infrared absorptions of the functional groups in the given molecule are,
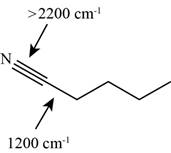
Figure 13
Explanation of Solution
The structure of the given molecule is,
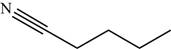
Figure 14
The possibilities of the IR stretching frequencies for the given molecule are shown as,

Figure 13
So, the stretching frequencies of
(h)
To determine: The characteristic infrared absorptions of the functional groups in the given molecule.
Interpretation: The characteristic infrared absorptions of the functional groups in the given molecule are to be predicted.
Concept introduction: An IR spectrum is a graph for the energy absorbed by a molecule as a function of the frequency or wavelength of light. Alkanes, alkenes and alkynes have characteristic
(h)
Answer to Problem 12.12SP
The characteristic infrared absorptions of the functional groups in the given molecule are,
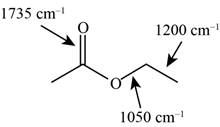
Figure 15
Explanation of Solution
The structure of the given molecule is,
Figure 16
The possibilities of the IR stretching frequencies for the given molecule are shown as,

Figure 15
So, the stretching frequencies of
(i)
To determine: The characteristic infrared absorptions of the functional groups in the given molecule.
Interpretation: The characteristic infrared absorptions of the functional groups in the given molecule are to be predicted.
Concept introduction: An IR spectrum is a graph for the energy absorbed by a molecule as a function of the frequency or wavelength of light. Alkanes, alkenes and alkynes have characteristic
(i)
Answer to Problem 12.12SP
The characteristic infrared absorptions of the functional groups in the given molecule are,
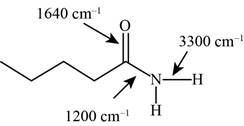
Figure 17
Explanation of Solution
The structure of the given molecule is,
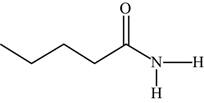
Figure 18
The possibilities of the IR stretching frequencies for the given molecule are shown as,
Figure 17
So, the stretching frequencies of
Want to see more full solutions like this?
Chapter 12 Solutions
ORGANIC CHEMISTRY

- Done 18:25 www-awu.aleks.com .III LTE Chapter 12 HW Question 29 of 39 (6 points) | Question Attempt: 1 of Unlimi... Oli 23 24 25 26 27 28 29 30 Consider this structure. CH2 CH2CH2 CH2CH2CH₂ C -C. -CH2CH3 H CH Part: 0 / 3 Part 1 of 3 Give the IUPAC name of this structure. Skip Part < Check ☑ Save For Later © 2025 McGraw Hill LLC. All Rights Reserved. Terms of Use | Privacy Center | Accessibility ....................arrow_forwardCalculate Ecell at 25.0 oC using the following line notation. Zn(s)|Zn+2(aq, 0.900 M)||Cu+2(aq, 0.000200 M)|Cu(s)arrow_forwardPredict the product of this organic reaction: O OH + H + OH A P + H2O Specifically, in the drawing area below draw the skeletal ("line") structure of P. If there isn't any P because this reaction won't happen, check the No reaction box under the drawing area. Explanation Check Click and drag to start drawing a structure. X G ☐ :arrow_forward
- 0.0994 g of oxalic acid dihydrate is titrated with 10.2 mL of potassium permanganate. Calculate the potassium permanganate concentration. Group of answer choices 0.0433 M 0.135 M 0.0309 M 0.193 Marrow_forwardExperts...can any one help me solve these problems?arrow_forwardAccording to standard reduction potential data in Lecture 4-1, which of the following species is the most difficult to reduce? Group of answer choices Zn2+ AgCl(s) Al3+ Ce4+arrow_forward
- Which Group 1 metal reacts with O2(g) to form a metal peroxide (M2O2)? Group of answer choices Li K Rb Naarrow_forwardWhich of the following statements is true regarding the reaction between Group 1 metals and water? Group of answer choices These reactions result in a basic solution. The metals do not actually react easily with water due to the metals' lack of conductivity. These reaction result in an acidic solution. The metals need their outer coatings of metal oxides to react.arrow_forwardWhich element cannot interact with hydrogen through hydrogen bonds? Group of answer choices O S Br Narrow_forward
- Which of the following statements is false regarding hydrogen gas production? Group of answer choices Steam reforming requires a catalyst. Methanol (CH3OH) can react with water using a ZnO catalyst to form H2(g). Methanol (CH3OH) can react with O2(g) using a Pd catalyst to form H2(g). The reaction between CH4(g) and H2O to form H2(g) requires a temperature of at least 700 oCarrow_forwardWhich of the following forms of hydrogen is the least stable? Group of answer choices H H2 H− H+arrow_forwardConsider the following reduction half reactions and standard reduction potentials: Fe3+ + e− → Fe2+ Eo = +0.77 V Fe2+ + e− → Fe(s) Eo = -0.44 V Which of the following statements is true? Group of answer choices The Fe2+ reduction to Fe(s) is spontaneous. Fe2+ can disproportionate into Fe3+ and Fe(s) The Fe3+ reduction to Fe2+ is not spontaneous. Fe3+ and Fe(s) can undergo a comproportionation reaction to form Fe2+arrow_forward
 Principles of Modern ChemistryChemistryISBN:9781305079113Author:David W. Oxtoby, H. Pat Gillis, Laurie J. ButlerPublisher:Cengage Learning
 Organic Chemistry: A Guided InquiryChemistryISBN:9780618974122Author:Andrei StraumanisPublisher:Cengage Learning