
Concept explainers
Videos
To draw stem and leaf plot, a histogram and a box and whisker plot with the given data.
Answer to Problem 119CUR
The given 3 diagrams are the required diagrams of the data.
Explanation of Solution
Given is the data
Graph: Stem and Leaf plot
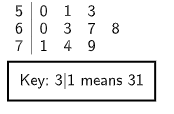
Interpretation of the graph: In the above graph , the data is spread and written in this way to make it more presentable. There are total 10 numbers, It helps in visualizing it better.
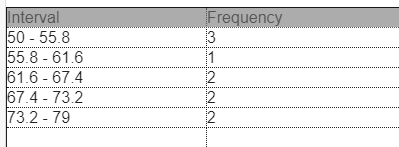
Graph: Histogram
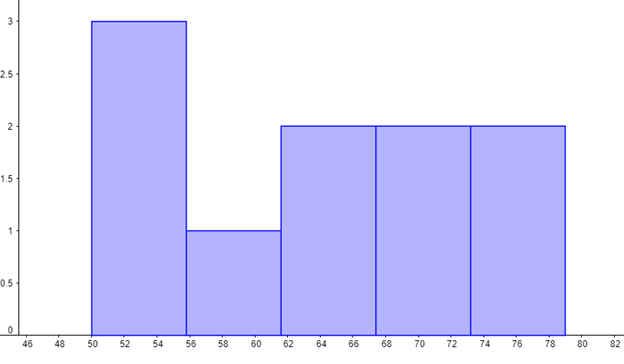
Interpretation of the graph: The histogram is made with the help of frequency
Graph: Box and whisker plot

To plot box and whisker, median, quartile 1 , quartile 3 , lower value and higher value is required.
To find median, Arrange the data in Ascending or Descending order.
Find the mean of two middle values if number of observation is even, else the middle value of the data will be the median
Calculation:
Arrange in ascending order 50,51,53,60,63,67,68,71,74,79
=(63+67)/2
=130/2
=65
Q1= Median of 50,51,53,60,63= 53
Q3= Median of 67,68,71,74,79= 71
Lower value = 50
Higher value= 79
Interpretation of the graph: In the graph, the middle line at 65 shows the median, On the left, Q1 and Lower value is represented and on the Right Q3 and higher value is represented.
Chapter 12 Solutions
Holt Mcdougal Larson Pre-algebra: Student Edition 2012
Additional Math Textbook Solutions
Basic Business Statistics, Student Value Edition
Elementary Statistics (13th Edition)
Algebra and Trigonometry (6th Edition)
A Problem Solving Approach To Mathematics For Elementary School Teachers (13th Edition)
College Algebra with Modeling & Visualization (5th Edition)


- Given the correlation coefficient (r-value), determine the strength of the relationship. Defend your answersarrow_forward??!!arrow_forwardrections: For problem rough 3, read each question carefully and be sure to show all work. 1. Determine if 9(4a²-4ab+b²) = (6a-3b)² is a polynomial identity. 2. Is (2x-y) (8x3+ y³) equivalent to 16x4-y4? 3. Find an expression that is equivalent to (a - b)³. Directions: For problems 4 and 5, algebraically prove that the following equations are polynomial identities. Show all of your work and explain each step. 4. (2x+5)² = 4x(x+5)+25 5. (4x+6y)(x-2y)=2(2x²-xy-6y²)arrow_forward
- Name: Mussels & bem A section of a river currently has a population of 20 zebra mussels. The population of zebra mussels increases 60 % each month. What will be the population of zebra mussels after 2 years? 9 10 # of months # of mussels 1 2 3 4 5 6 7 8 o Graph your data. Remember to title your graph. What scale should be used on the y-axis? What scale should be used on the x-axis? Exponential Growth Equation y = a(1+r)*arrow_forwardIn a national park, the current population of an endangered species of bear is 80. Each year, the population decreases by 10%. How can you model the population of bears in the park? # of years # of bears 9 10 2 3 4 5 6 7 8 ° 1 Graph your data. Remember to title your graph. What scale should be used on the y-axis? What scale should be used on the x-axis? SMOKY 19 OUNTAINS NATIONAL Exponential Decay Equation y = a(1-r)* PARKarrow_forwardOn Feb. 8, this year, at 6am in the morning all UiB meteorology professors met to discuss a highly unfortunate and top-urgent crisis: Their most precious instrument, responsible for measuring the air temperature hour-by- hour, had failed - what if the Bergen public would find out? How would they plan their weekend without up-to-date air temperature readings? Silent devastation - and maybe a hint of panic, also - hung in the room. Apprentice Taylor, who - as always - was late to the meeting, sensed that this was his chance to shine! Could they fake the data? At least for some hours (until the measurements would work again)? He used to spend a lot of time online and thus knew the value of fake data, especially when it spread fast! He reminded the crying professors of a prehistoric project with the title "Love your derivatives as you love yourself!" - back then, they had installed top-modern technology that not only measured the air temperature itself, but also its 1st, 2nd, 3rd, 4th, and…arrow_forward
- Consider a forest where the population of a particular plant species grows exponentially. In a real-world scenario, we often deal with systems where the analytical function describing the phenomenon is not available. In such cases, numerical methods come in handy. For the sake of this task, however, you are provided with an analytical function so that you can compare the results of the numerical methods to some ground truth. The population P(t) of the plants at time t (in years) is given by the equation: P(t) = 200 0.03 t You are tasked with estimating the rate of change of the plant population at t = 5 years using numerical differentiation methods. First, compute the value of P'(t) at t = 5 analytically. Then, estimate P'(t) at t = 5 years using the following numerical differentiation methods: ⚫ forward difference method (2nd-order accurate) 3 ⚫ backward difference method (2nd-order accurate) ⚫ central difference method (2nd-order accurate) Use h = 0.5 as the step size and round all…arrow_forwardNicole organized a new corporation. The corporation began business on April 1 of year 1. She made the following expenditures associated with getting the corporation started: Expense Date Amount Attorney fees for articles of incorporation February 10 $ 40,500 March 1-March 30 wages March 30 6,550 March 1-March 30 rent Stock issuance costs March 30 2,850 April 1-May 30 wages Note: Leave no answer blank. Enter zero if applicable. April 1 May 30 24,000 16,375 c. What amount can the corporation deduct as amortization expense for the organizational expenditures and for the start-up costs for year 1 [not including the amount determined in part (b)]? Note: Round intermediate calculations to 2 decimal places and final answer to the nearest whole dollar amount. Start-up costs amortized Organizational expenditures amortizedarrow_forwardLast Chance Mine (LCM) purchased a coal deposit for $2,918,300. It estimated it would extract 18,950 tons of coal from the deposit. LCM mined the coal and sold it, reporting gross receipts of $1.24 million, $13 million, and $11 million for years 1 through 3, respectively. During years 1-3, LCM reported net income (loss) from the coal deposit activity in the amount of ($11,400), $550,000, and $502,500, respectively. In years 1-3, LCM extracted 19,950 tons of coal as follows: (1) Tons of Coal 18,950 Depletion (2) Basis (2)(1) Rate $2,918,300 $154.00 Tons Extracted per Year Year 1 4,500 Year 2 8,850 Year 3 6,600 Note: Leave no answer blank. Enter zero if applicable. Enter your answers in dollars and not in millions of dollars. a. What is LCM's cost depletion for years 1, 2, and 3? Cost Depletion Year 1 Year 2 Year 3arrow_forward
- Consider the following equation. log1/9' =6 Find the value of x. Round your answer to the nearest thousandth. x = ✓arrow_forwardExpanding a logarithmic expression: Problem type 3 Use the properties of logarithms to expand the following expression. 4(8+x)² log 5 ) Your answer should not have radicals or exponents. You may assume that all variables are positive. log 4(8 + X 5 -x)²arrow_forwardUse the properties of logarithms to expand the following expression. log 6(x+5)² 3/24 Your answer should not have radicals or exponents. You may assume that all variables are positive. log 6(x + 3 I 4 5)² log Xarrow_forward
 Algebra and Trigonometry (6th Edition)AlgebraISBN:9780134463216Author:Robert F. BlitzerPublisher:PEARSON
 Contemporary Abstract AlgebraAlgebraISBN:9781305657960Author:Joseph GallianPublisher:Cengage Learning
 Linear Algebra: A Modern IntroductionAlgebraISBN:9781285463247Author:David PoolePublisher:Cengage Learning
 Algebra And Trigonometry (11th Edition)AlgebraISBN:9780135163078Author:Michael SullivanPublisher:PEARSON
 Introduction to Linear Algebra, Fifth EditionAlgebraISBN:9780980232776Author:Gilbert StrangPublisher:Wellesley-Cambridge Press
 College Algebra (Collegiate Math)AlgebraISBN:9780077836344Author:Julie Miller, Donna GerkenPublisher:McGraw-Hill Education