The graph shows that U.S. adults dependent on tobacco have a greater probability of suffering from some ailments than the general adult population. When making two or more selections from populations with large numbers, such as the U.S. adult population or the population dependent on tobacco, we assume that each selection is independent of every other selection. In Exercises 27-32, assume that the selections are independent events. an Independent and then a Democrat.
The graph shows that U.S. adults dependent on tobacco have a greater probability of suffering from some ailments than the general adult population. When making two or more selections from populations with large numbers, such as the U.S. adult population or the population dependent on tobacco, we assume that each selection is independent of every other selection. In Exercises 27-32, assume that the selections are independent events. an Independent and then a Democrat.
Solution Summary: The author explains that the probability of selecting an Independent and then a Democrat is 442.
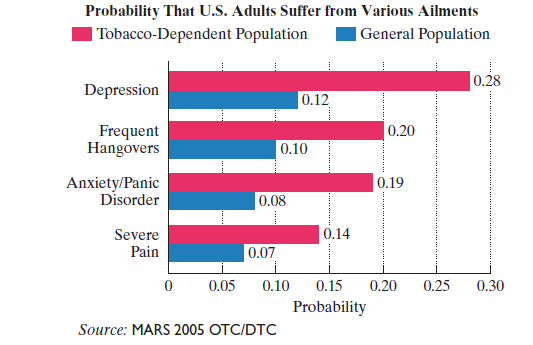
The graph shows that U.S. adults dependent on tobacco have a greater probability of suffering from some ailments than the general adult population. When making two or more selections from populations with large numbers, such as the U.S. adult population or the population dependent on tobacco, we assume that each selection is independent of every other selection. In Exercises 27-32, assume that the selections are independent events.
(x^2+y^2)dx+(x^2-xy)dy=0 , Determine if the equation is homogeneous.
42. Consider the following joint probability table.
B₁
B2
B3
B4
A
0.09
0.22
0.15
0.20
A
0.03
0.10
0.09
0.12
EXERCISES 4.3
Mechanics
41. Consider the following contingency table.
B
B
A
26
34
Ac
14
26
a. Convert the contingency table into a joint probability table.
b. What is the probability that A occurs?
ن فة
What is the probability that A and B occur?
d. Given that B has occurred, what is the probability that
A occurs?
e. Given that A has occurred, what is the probability that
B occurs?
f.
Are A and B mutually exclusive events? Explain.
g.
Are A and B independent events? Explain.
42. Consider the following joint probability table.
B₁
B2
B3
BA
A
0.09
0.22
0.15
0.20
Ac
0.03
0.10
0.09
0.12
Probability And Statistical Inference (10th Edition)
Knowledge Booster
Learn more about
Need a deep-dive on the concept behind this application? Look no further. Learn more about this topic, subject and related others by exploring similar questions and additional content below.
Probability & Statistics (28 of 62) Basic Definitions and Symbols Summarized; Author: Michel van Biezen;https://www.youtube.com/watch?v=21V9WBJLAL8;License: Standard YouTube License, CC-BY
Introduction to Probability, Basic Overview - Sample Space, & Tree Diagrams; Author: The Organic Chemistry Tutor;https://www.youtube.com/watch?v=SkidyDQuupA;License: Standard YouTube License, CC-BY


 Holt Mcdougal Larson Pre-algebra: Student Edition...AlgebraISBN:9780547587776Author:HOLT MCDOUGALPublisher:HOLT MCDOUGAL
 Algebra & Trigonometry with Analytic GeometryAlgebraISBN:9781133382119Author:SwokowskiPublisher:Cengage
 Glencoe Algebra 1, Student Edition, 9780079039897...AlgebraISBN:9780079039897Author:CarterPublisher:McGraw Hill