
a.
To find: The average rate of change of the population from
The average rate of change of the population from year
Given information: The table below shows the population growth of Clark County:
| Year | Population |
Calculation:
From the table, it can be observed that the population in
Calculate the average rate of change of the population from year
Calculate the average rate of change of the population from year
Thus, the average rate of change of the population from year
b.
To graph: The scatter plot of the given data and appropriate regression graph.
The scatter plot of the given data is shown in figure (1) and appropriate regression is shown in figure (3).
Given information: The table below shows the population growth of Clark County:
| Year | Population |
Graph:
To scatter plot of the given data in graphing calculator, under
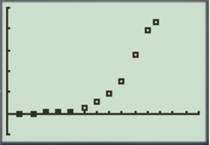
Figure (1)
To find the logistic equation from the given data, select
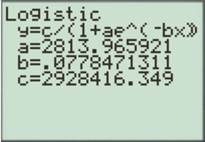
Figure (2)
The logistic equation of the given data is:
Now, draw the graph of the equation as shown below in the viewing window
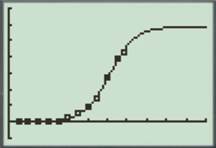
Figure (3)
Thus, the scatter plot of the given data is shown in figure (1) and appropriate regression is shown in figure (3).
c.
To find: The instantaneous rate of change of the population and the year in which fastest growth occur.
The instantaneous rate of change of the population is
Given information: The table below shows the population growth of Clark County:
| Year | Population |
Calculation:
From figure (3) in part (b), the curve grows fastest at
Press
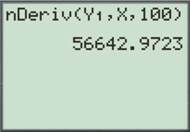
Figure (4)
Thus, the instantaneous rate of change of the population is
Chapter 11 Solutions
PRECALCULUS:GRAPHICAL,...-NASTA ED.

- Let the region R be the area enclosed by the function f(x)= = 3x² and g(x) = 4x. If the region R is the base of a solid such that each cross section perpendicular to the x-axis is an isosceles right triangle with a leg in the region R, find the volume of the solid. You may use a calculator and round to the nearest thousandth. y 11 10 9 00 8 7 9 5 4 3 2 1 -1 -1 x 1 2arrow_forwardLet the region R be the area enclosed by the function f(x) = ex — 1, the horizontal line y = -4 and the vertical lines x = 0 and x = 3. Find the volume of the solid generated when the region R is revolved about the line y = -4. You may use a calculator and round to the nearest thousandth. 20 15 10 5 y I I I | I + -1.5 -1 -0.5 0.5 1 1.5 2 2.5 3 -5 I -10 -15 I + I I T I I + -20 I + -25 I I I -30 I 3.5 4 xarrow_forwardplease show all the workarrow_forward
 Calculus: Early TranscendentalsCalculusISBN:9781285741550Author:James StewartPublisher:Cengage Learning
 Thomas' Calculus (14th Edition)CalculusISBN:9780134438986Author:Joel R. Hass, Christopher E. Heil, Maurice D. WeirPublisher:PEARSON
 Calculus: Early Transcendentals (3rd Edition)CalculusISBN:9780134763644Author:William L. Briggs, Lyle Cochran, Bernard Gillett, Eric SchulzPublisher:PEARSON
 Calculus: Early TranscendentalsCalculusISBN:9781319050740Author:Jon Rogawski, Colin Adams, Robert FranzosaPublisher:W. H. Freeman
 Calculus: Early Transcendental FunctionsCalculusISBN:9781337552516Author:Ron Larson, Bruce H. EdwardsPublisher:Cengage Learning