
Statistics, Books a la Carte Edition Plus MyLab Statistics with Pearson eText -- Access Card Package (4th Edition)
4th Edition
ISBN: 9780134435855
Author: Alan Agresti, Christine A. Franklin, Bernhard Klingenberg
Publisher: PEARSON
expand_more
expand_more
format_list_bulleted
Concept explainers
Videos
Textbook Question
Chapter 11.2, Problem 9PB
Happiness and gender For the 2 × 3 table on gender and happiness in Exercise 11.4 (shown below), software tells us that X2 = 1.04 and the P-value = 0.59.
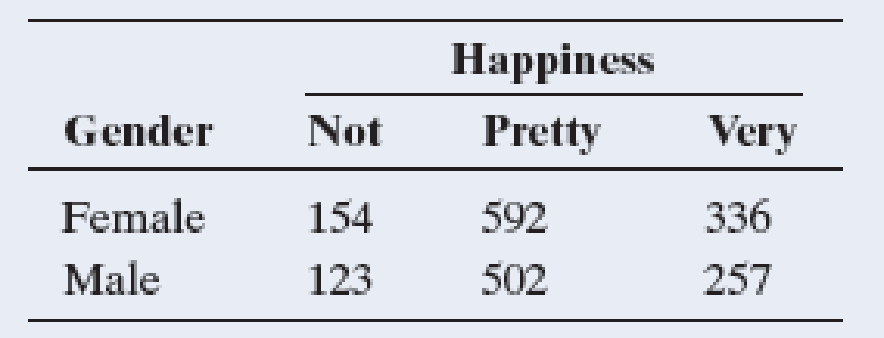
- a. State the null and alternative hypothesis, in context, to which these results apply.
- b. Interpret the P-value.
Expert Solution & Answer
Want to see the full answer?
Check out a sample textbook solution
Students have asked these similar questions
It is thought that prehistoric Native Americans did not take their best tools, pottery, and household items when they visited higher elevations for their summer camps. It is hypothesized that archaeological sites tend to lose their cultural identity and specific cultural affiliation as the elevation of the site increases. Let x be the elevation (in thousands of feet) for an archaeological site in the southwestern United States. Let y be the percentage of unidentified artifacts (no specific cultural affiliation) at a given elevation. Suppose that the following data were obtained for a collection of archaeological sites in New Mexico:
x
5.50
6.00
6.75
7.00
7.75
y
37
38
92
70
99
Find the equation of the least squares line . Round a and b to three decimal places.
A fitness trainer wants to estimate the effect of fitness activities on muscle mass for different weight categories of club members. They choose the most popular fitness classes at the gym: yoga, circuit training, and high-intensity interval training (HIIT). Suppose that the weights of club members are separated into three levels: under 155 pounds, 155 – 200 pounds, and over 200 pounds. Draw a flow chart showing the design of this experiment.
The systolic blood pressure of individuals is thought to be related to both age and weight. Let the systolic blood pressure, age, and weight be represented by the variables x1, x2, and x3, respectively. Suppose that Minitab was used to generate the following descriptive statistics, correlations, and regression analysis for a random sample of 15 individuals.
Descriptive Statistics
Variable
N
Mean
Median
TrMean
StDev
SE Mean
x 1
15
154.14
154.34
154.14
3.842
0.992000
x 2
15
59.69
60.19
59.69
1.462
0.377487
x 3
15
205.55
204.75
205.55
4.558
1.176871
Variable
Minimum
Maximum
Q1
Q3
x 1
125
178
141.803
167.244
x 2
41
80
47.754
78.415
x 3
126
240
140.395
224.008
Correlations (Pearson)
x 1
x 2
x 2
0.892
x 3
0.839
0.567
Regression Analysis
The regression equation is
x 1 = 0.883 + 1.257x2 + 0.871x3
Predictor
Coef
StDev
T
P
Constant
0.883
0.635
1.39
0.095
x 2
1.257
0.635
1.98
0.036
x 3
0.871
0.419
2.08
0.030
S = 0.428
R-sq = 92.7 %…
Chapter 11 Solutions
Statistics, Books a la Carte Edition Plus MyLab Statistics with Pearson eText -- Access Card Package (4th Edition)
Ch. 11.1 - Gender gap in politics? In the United States, is...Ch. 11.1 - Prob. 2PBCh. 11.1 - Williams College admission Data from 2013 posted...Ch. 11.1 - Prob. 4PBCh. 11.1 - Marital happiness and income In the GSS, subjects...Ch. 11.1 - What is independent of happiness? Which one of the...Ch. 11.1 - Sample evidence about independence Refer to the...Ch. 11.2 - Life after death and gender In the 2012 GSS, 605...Ch. 11.2 - Happiness and gender For the 2 3 table on gender...Ch. 11.2 - Prob. 10PB
Ch. 11.2 - Marital happiness and income In Exercise 11.5 when...Ch. 11.2 - First and second free throw independent? In pro...Ch. 11.2 - Cigarettes and marijuana The table on the...Ch. 11.2 - Prob. 14PBCh. 11.2 - Help the environment In 2010 the GSS asked whether...Ch. 11.2 - Prob. 16PBCh. 11.2 - Aspirin and heart attacks A Swedish study used...Ch. 11.2 - z test for heart attack study Refer to the...Ch. 11.2 - Severity of fever after flu shot The study...Ch. 11.2 - Prob. 20PBCh. 11.2 - Testing a genetic theory In an experiment on...Ch. 11.2 - Birthdays by quarters Based on a random sample of...Ch. 11.2 - Checking a roulette wheel Karl Pearson devised the...Ch. 11.3 - Democrat, race, and gender The two tables show...Ch. 11.3 - Death penalty associations Table 11.10, summarized...Ch. 11.3 - Smoking and alcohol The table refers to a survey...Ch. 11.3 - Sex of victim and offender For murders in the...Ch. 11.3 - Smelling and mortality A recent study (Pinto et...Ch. 11.3 - Vioxx In September 2004, the pharmaceutical...Ch. 11.3 - Egg and cell derived vaccine When comparing the...Ch. 11.3 - Risk of dying for teenagers According to...Ch. 11.3 - Marital happiness The table shows 2012 GSS data on...Ch. 11.3 - Party ID and gender The table shows the 2012 GSS...Ch. 11.3 - Chi-squared versus measuring association For the...Ch. 11.4 - Standardized residuals for happiness and income...Ch. 11.4 - Prob. 36PBCh. 11.4 - Prob. 37PBCh. 11.4 - Prob. 38PBCh. 11.4 - Prob. 39PBCh. 11.4 - Prob. 40PBCh. 11.5 - Keeping old dogs mentally sharp In an experiment...Ch. 11.5 - Prob. 43PBCh. 11.5 - Prob. 44PBCh. 11.5 - Prob. 46PBCh. 11 - Female for president? When recent General Social...Ch. 11 - Prob. 48CPCh. 11 - Down and chi-squared For the data in the previous...Ch. 11 - Prob. 50CPCh. 11 - Prob. 51CPCh. 11 - Prob. 52CPCh. 11 - Prob. 53CPCh. 11 - Prob. 54CPCh. 11 - Prob. 55CPCh. 11 - Prob. 56CPCh. 11 - Seat belt helps? The table refers to passengers in...Ch. 11 - Prob. 58CPCh. 11 - Prob. 59CPCh. 11 - Prob. 60CPCh. 11 - Prob. 61CPCh. 11 - Prob. 62CPCh. 11 - Prob. 63CPCh. 11 - Prob. 64CPCh. 11 - Clarity of diamonds Does the clarity of a diamond...Ch. 11 - Benfords Law When looking at a collection of...Ch. 11 - Prob. 67CPCh. 11 - Prob. 68CPCh. 11 - Prob. 70CPCh. 11 - Prob. 71CPCh. 11 - Prob. 72CPCh. 11 - Prob. 73CPCh. 11 - Prob. 74CPCh. 11 - Prob. 75CPCh. 11 - Prob. 76CPCh. 11 - Prob. 77CPCh. 11 - Prob. 78CPCh. 11 - Prob. 79CPCh. 11 - Statistical versus practical significance In any...Ch. 11 - Prob. 81CPCh. 11 - Multiple response variables Each subject in a...Ch. 11 - Standardized residuals for 2 2 tables The table...Ch. 11 - Prob. 84CPCh. 11 - Prob. 85CPCh. 11 - Prob. 86CPCh. 11 - Prob. 87CPCh. 11 - Prob. 88CPCh. 11 - Voting with 16 A recent survey of Austrian high...
Knowledge Booster


Learn more about
Need a deep-dive on the concept behind this application? Look no further. Learn more about this topic, statistics and related others by exploring similar questions and additional content below.Similar questions
- According to health professionals, a person’s weight is expected to increase with age. To examine that statement, a nutritionist collected data from 11 random females from different age categories between the ages of 21 and 43. In the following table, x is the age of a person and y is the weight in pounds. x, age 21 24 27 29 31 33 35 38 40 42 43 y, weight in lb 121.4 122.3 130.3 131.7 133.3 134.6 136.7 138.4 140.3 142.0 145.1 Select the correct graph of the least-squares line on a scatter diagram.arrow_forwardLet x be a random variable that represents the percentage of successful free throws a professional basketball player makes in a season. Let y be a random variable that represents the percentage of successful field goals a professional basketball player makes in a season. A random sample of n = 6 professional basketball players gave the following information. x 82 69 73 84 74 64 y 42 48 46 46 46 42 Verify that ∑x =446, ∑y =270, ∑x2 =33,442, ∑y2 =12,180, ∑xy =20,070, and r = 0, and find the critical value for a test using a 5% level of significance claiming that ρis not equal than zero. Round your answer to three decimal places.arrow_forwardLet x be a random variable that represents the percentage of successful free throws a professional basketball player makes in a season. Let y be a random variable that represents the percentage of successful field goals a professional basketball player makes in a season. A random sample of n = 6 professional basketball players gave the following information. x 75 72 75 81 74 81 y 46 39 42 47 49 50 Verify that Se ࣈ 3.591,a ࣈ –10.145, bࣈ0.729, and , and find the predicted percentage of successful field goals for a player with x= 88%successful free throws. Round your answer to the nearest tenth of a percentarrow_forward
- An editor wants to analyze if there is a significant difference in the ratings of books in four different genres. Random samples of book ratings were collected for four different genres. The editor recorded ratings in a 0 to 10 scale in the following table. Fiction Novel Biography Science&Technology 8.5 8.4 6.2 9.1 5.3 5.3 5.5 4.3 7.7 4.2 7.0 9.7 5.1 9.8 9.3 5.2 6.9 8.6 6.7 7.9 4.8 7.1 6.9 8.4 Shall we reject or not reject the claim that there are no differences among the population means of book ratings for the different genres? Use.arrow_forwardPeggy conducted a study to identify the randomness of rainy days in fall. For 15 days, she recorded whether it rained that day or not. They denoted a rainy day with the letter R, a day without rain with the letter N. R N N R R N N R R N N R R R R Test the sequence for randomness. Use .arrow_forwardConsider the grades for the math and history exams for 10 students on a scale from 0 to 12 in the following table. Student Math History 1 4 8 2 5 9 3 7 9 4 12 10 5 10 8 6 8 5 7 9 6 8 9 6 9 11 9 10 7 10 Compute the Spearman correlation coefficient. Round your answer to three decimal places.arrow_forward
- To compare two elementary schools regarding teaching of reading skills, 12 sets of identical twins were used. In each case, one child was selected at random and sent to school A, and his or her twin was sent to school B. Near the end of fifth grade, an achievement test was given to each child. The results follow: Twin Pair 1 2 3 4 5 6 School A 169 157 115 99 119 113 School B 123 157 112 99 121 122 Twin Pair 7 8 9 10 11 12 School A 120 121 124 145 138 117 School B 153 90 124 140 142 102 Suppose a sign test for matched pairs with a 1% level of significance is used to test the hypothesis that the schools have the same effectiveness in teaching reading skills against the alternate hypothesis that the schools have different levels of effectiveness in teaching reading skills. Let p denote portion of positive signs when the scores of school B are subtracted from the corresponding scores of school…arrow_forwardA horse trainer teaches horses to jump by using two methods of instruction. Horses being taught by method A have a lead horse that accompanies each jump. Horses being taught by method B have no lead horse. The table shows the number of training sessions required before each horse performed the jumps properly. Method A 25 23 39 29 37 20 Method B 41 21 46 42 24 44 Method A 45 35 27 31 34 49 Method B 26 43 47 32 40 Use a rank-sum test with a5% level of significance to test the claim that there is no difference between the training sessions distributions. If the value of the sample test statistic R, the rank-sum, is 150, calculate the P-value. Round your answer to four decimal places.arrow_forwardA data processing company has a training program for new salespeople. After completing the training program, each trainee is ranked by his or her instructor. After a year of sales, the same class of trainees is again ranked by a company supervisor according to net value of the contracts they have acquired for the company. The results for a random sample of 11 salespeople trained in the last year follow, where x is rank in training class and y is rank in sales after 1 year. Lower ranks mean higher standing in class and higher net sales. Person 1 2 3 4 5 6 x rank 8 11 2 4 5 3 y rank 7 10 1 3 2 4 Person 7 8 9 10 11 x rank 7 9 10 1 6 y rank 8 11 9 6 5 Using a 1% level of significance, test the claim that the relation between x and y is monotone (either increasing or decreasing). Verify that the Spearman rank correlation coefficient . This implies that the P-value lies between 0.002 and 0.01. State…arrow_forward
- Sand and clay studies were conducted at a site in California. Twelve consecutive depths, each about 15 cm deep, were studied and the following percentages of sand in the soil were recorded. 34.4 27.1 30.8 28.0 32.2 27.6 32.8 25.2 31.4 33.5 24.7 28.4 Converting this sequence of numbers to a sequence of symbols A and B, where A indicates a value above the median and B denotes a value below the median gives ABABABABAABB. Test the sequence for randomness about the median with a 5% level of significance. Verify that the number of runs is 10. What is the upper critical value c2? arrow_forwardSand and clay studies were conducted at a site in California. Twelve consecutive depths, each about 15 cm deep, were studied and the following percentages of sand in the soil were recorded. 34.4 27.1 30.8 28.0 32.2 27.6 32.8 25.2 31.4 33.5 24.7 28.4 Converting this sequence of numbers to a sequence of symbols A and B, where A indicates a value above the median and B denotes a value below the median gives ABABABABAABB. Test the sequence for randomness about the median with a 5% level of significance. Verify that the number of runs is 10. What is the upper critical value c2?arrow_forward29% of all college students major in STEM (Science, Technology, Engineering, and Math). If 46 college students are randomly selected, find the probability thata. Exactly 11 of them major in STEM. b. At most 12 of them major in STEM. c. At least 11 of them major in STEM. d. Between 11 and 15 (including 11 and 15) of them major in STEM.arrow_forward
arrow_back_ios
SEE MORE QUESTIONS
arrow_forward_ios
Recommended textbooks for you
 Glencoe Algebra 1, Student Edition, 9780079039897...AlgebraISBN:9780079039897Author:CarterPublisher:McGraw Hill
 Holt Mcdougal Larson Pre-algebra: Student Edition...AlgebraISBN:9780547587776Author:HOLT MCDOUGALPublisher:HOLT MCDOUGAL
 Big Ideas Math A Bridge To Success Algebra 1: Stu...AlgebraISBN:9781680331141Author:HOUGHTON MIFFLIN HARCOURTPublisher:Houghton Mifflin Harcourt
 College Algebra (MindTap Course List)AlgebraISBN:9781305652231Author:R. David Gustafson, Jeff HughesPublisher:Cengage Learning
Glencoe Algebra 1, Student Edition, 9780079039897...
Algebra
ISBN:9780079039897
Author:Carter
Publisher:McGraw Hill
Holt Mcdougal Larson Pre-algebra: Student Edition...
Algebra
ISBN:9780547587776
Author:HOLT MCDOUGAL
Publisher:HOLT MCDOUGAL
Big Ideas Math A Bridge To Success Algebra 1: Stu...
Algebra
ISBN:9781680331141
Author:HOUGHTON MIFFLIN HARCOURT
Publisher:Houghton Mifflin Harcourt
College Algebra (MindTap Course List)
Algebra
ISBN:9781305652231
Author:R. David Gustafson, Jeff Hughes
Publisher:Cengage Learning
Hypothesis Testing - Solving Problems With Proportions; Author: The Organic Chemistry Tutor;https://www.youtube.com/watch?v=76VruarGn2Q;License: Standard YouTube License, CC-BY
Hypothesis Testing and Confidence Intervals (FRM Part 1 – Book 2 – Chapter 5); Author: Analystprep;https://www.youtube.com/watch?v=vth3yZIUlGQ;License: Standard YouTube License, CC-BY