
Videos
A newspaper story headline reads “Gender Plays Part in Monkeys’ Toy Choices, Research Finds—Like Humans, Male Monkeys Choose Balls and Cars, While Females Prefer Dolls and Pots” (Knight Ridder Newspapers, December 8, 2005). The article goes on to summarize findings published in the paper “Sex Differences in Response to Children’s Toys in Nonhuman Primates” (Evolution and Human Behavior [2002]: 467–479). Forty-four male monkeys and 44 female monkeys were each given a variety of toys, and the time spent playing with each toy was recorded. The table below gives means and standard deviations (approximate values read from graphs in the paper) for the percentage of time that a monkey spent playing with a particular toy. Assume that it is reasonable to regard these two samples of 44 monkeys as representative of the populations of male monkeys and female monkeys. Use a 0.05 significance level for any hypothesis tests that you carry out when answering the various parts of this exercise.
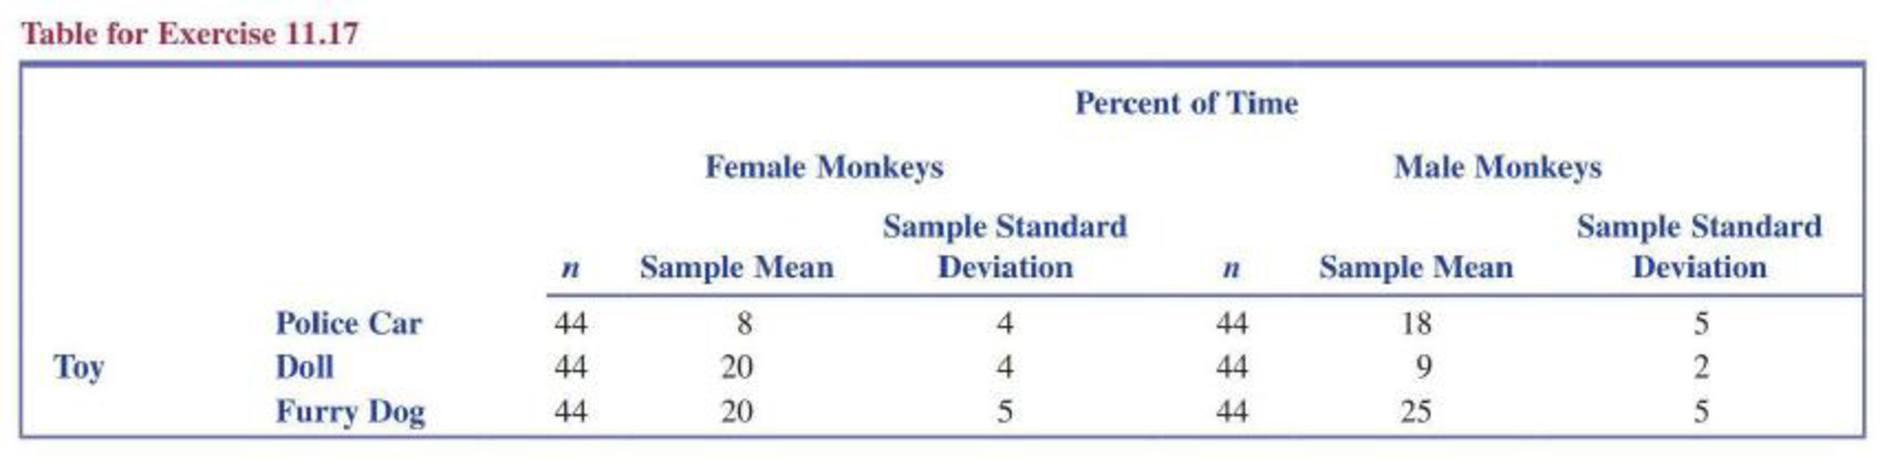
- a. The police car was considered a “masculine toy.” Do these data provide convincing evidence that the
mean percentage of the time spent playing with the police car is greater for male monkeys than for female monkeys? - b. The doll was considered a “feminine toy.” Do these data provide convincing evidence that the mean percentage of time spent playing with the doll is greater for female monkeys than for male monkeys?
- c. The furry dog was considered a “neutral toy.” Do these data provide convincing evidence that the mean percentage of time spent playing with the furry dog is not the same for male and female monkeys?
- d. Based on the conclusions from the hypothesis tests of Parts (a)–(c), is the quoted newspaper story headline a reasonable summary of the findings? Explain.
- e. Explain why it would be inappropriate to use the two-sample t test to decide if there was evidence that the mean percentage of time spent playing with the police car and the mean percentage of the time spent playing with the doll is not the same for female monkeys.
a.
Check whether mean percentage of time spent playing with police car is greater for male monkeys than for female monkeys or not.
Answer to Problem 17E
There is convincing evidence that mean percentage of time spent playing with police car is greater for male monkeys than for female monkeys.
Explanation of Solution
Calculation:
Given table provides the percentage of time spent playing with toys.
The assumptions for the two-sample t-test:
- The random samples should be collected independently.
- The sample sizes should be large. That is, each sample size is at least 30.
The assumptions in this particular problem:
- Two samples of 44 monkeys are selected randomly and independently from the population.
- The sample sizes are large enough.
Here, both sample sizes are equal to 44 and which are greater than 30.
Therefore, the assumptions are satisfied.
Let
Let
Hypotheses:
Null hypothesis:
That is, the mean percentage of time playing with police car is same for both male and female monkeys.
Alternative hypothesis:
That is, the mean percentage of time spent playing with police car is greater for male monkeys than for female monkeys.
Test statistic and P-value:
Software procedure:
Step by step procedure to obtain the P-value and test statistic by using MINITAB software is as follows:
- Choose Stat > Basic Statistics > 2 sample t.
- Choose Summarized data.
- In sample 1, enter Sample size as 44, Mean as 18, Standard deviation as 5.
- In sample 2, enter Sample size as 44, Mean as 8, Standard deviation as 4.
- Choose Options.
- In Confidence level, enter 95.
- In Alternative, select greater than.
- Click OK in all the dialogue boxes.
Output using the MINITAB software is given below:
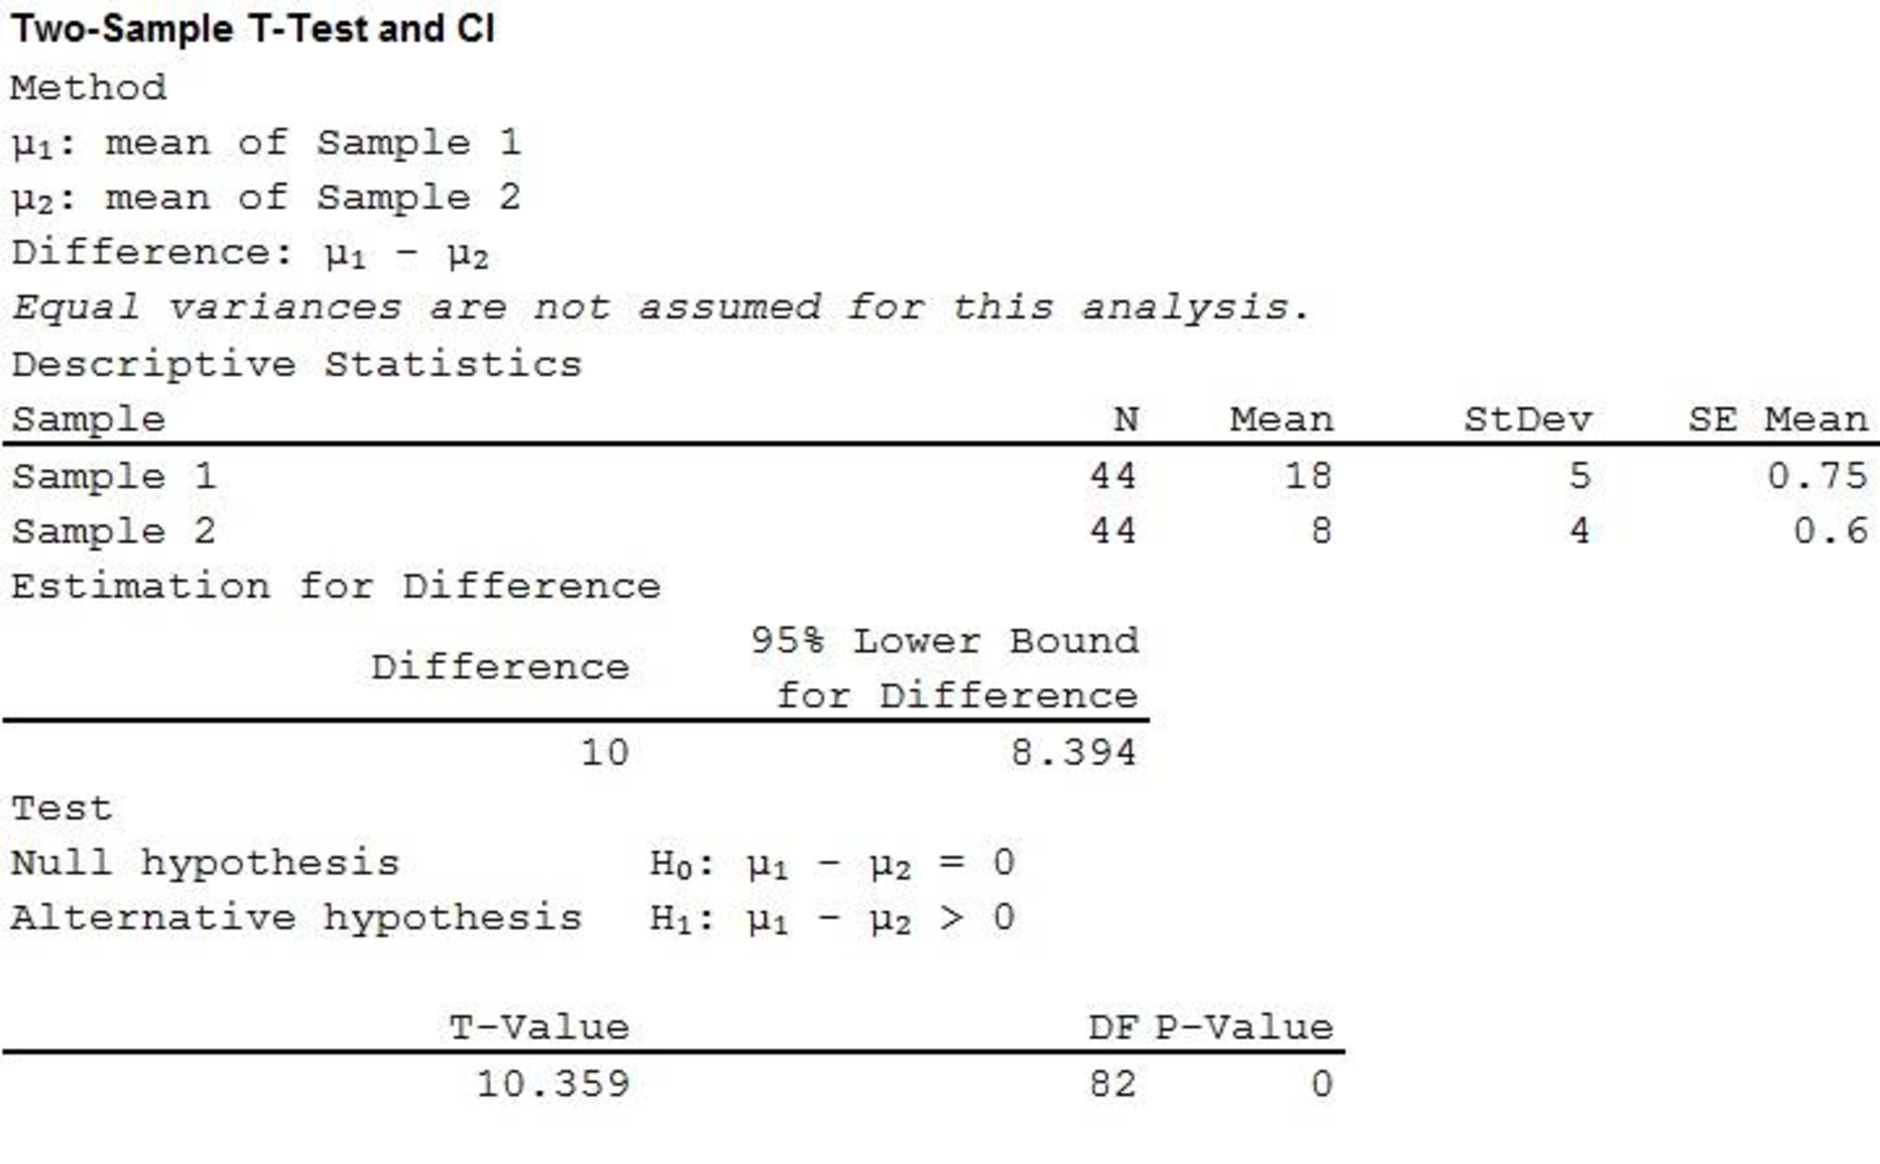
Therefore, the P-value is 0 and the test statistic is 10.359.
Decision rule:
- If P-value is less than or equal to the level of significance, reject the null hypothesis.
- Otherwise fail to reject the null hypothesis.
Conclusion:
Here, the level of significance is 0.05.
Here, P-value is less than the level of significance.
That is,
Therefore, reject the null hypothesis.
Hence, there is proper evidence to support the claim that the mean percentage of time spent playing with police car is greater for male monkeys than for female monkeys.
b.
Check whether mean percentage of time spent playing with doll is greater for female monkeys than for male monkeys or not.
Answer to Problem 17E
There is convincing evidence that mean percentage of time spent playing with doll is greater for female monkeys than for male monkeys.
Explanation of Solution
Calculation:
The assumption for the two-sample t-test:
- The random samples should be collected independently.
- The sample sizes should be large. That is, each sample size is at least 30.
The assumptions in this particular problem:
- Two samples of 44 monkeys are selected randomly and independently from the population.
- The sample sizes are large enough.
Here, both sample sizes are equal to 44 and which are greater than 30.
Therefore, the assumptions are satisfied.
Let
Let
Hypotheses:
Null hypothesis:
That is, the mean percentage of time playing with doll is same for both male and female monkeys.
Alternative hypothesis:
That is, the mean percentage of time spent playing with doll is greater for female monkeys than for male monkeys.
Test statistic and P-value:
Software procedure:
Step by step procedure to obtain the P-value and test statistic by using MINITAB software is as follows:
- Choose Stat > Basic Statistics > 2 sample t.
- Choose Summarized data.
- In sample 1, enter Sample size as 44, Mean as 9, Standard deviation as 2.
- In sample 2, enter Sample size as 44, Mean as 20, Standard deviation as 4.
- Choose Options.
- In Confidence level, enter 95.
- In Alternative, select less than.
- Click OK in all the dialogue boxes.
Output using the MINITAB software is given below:
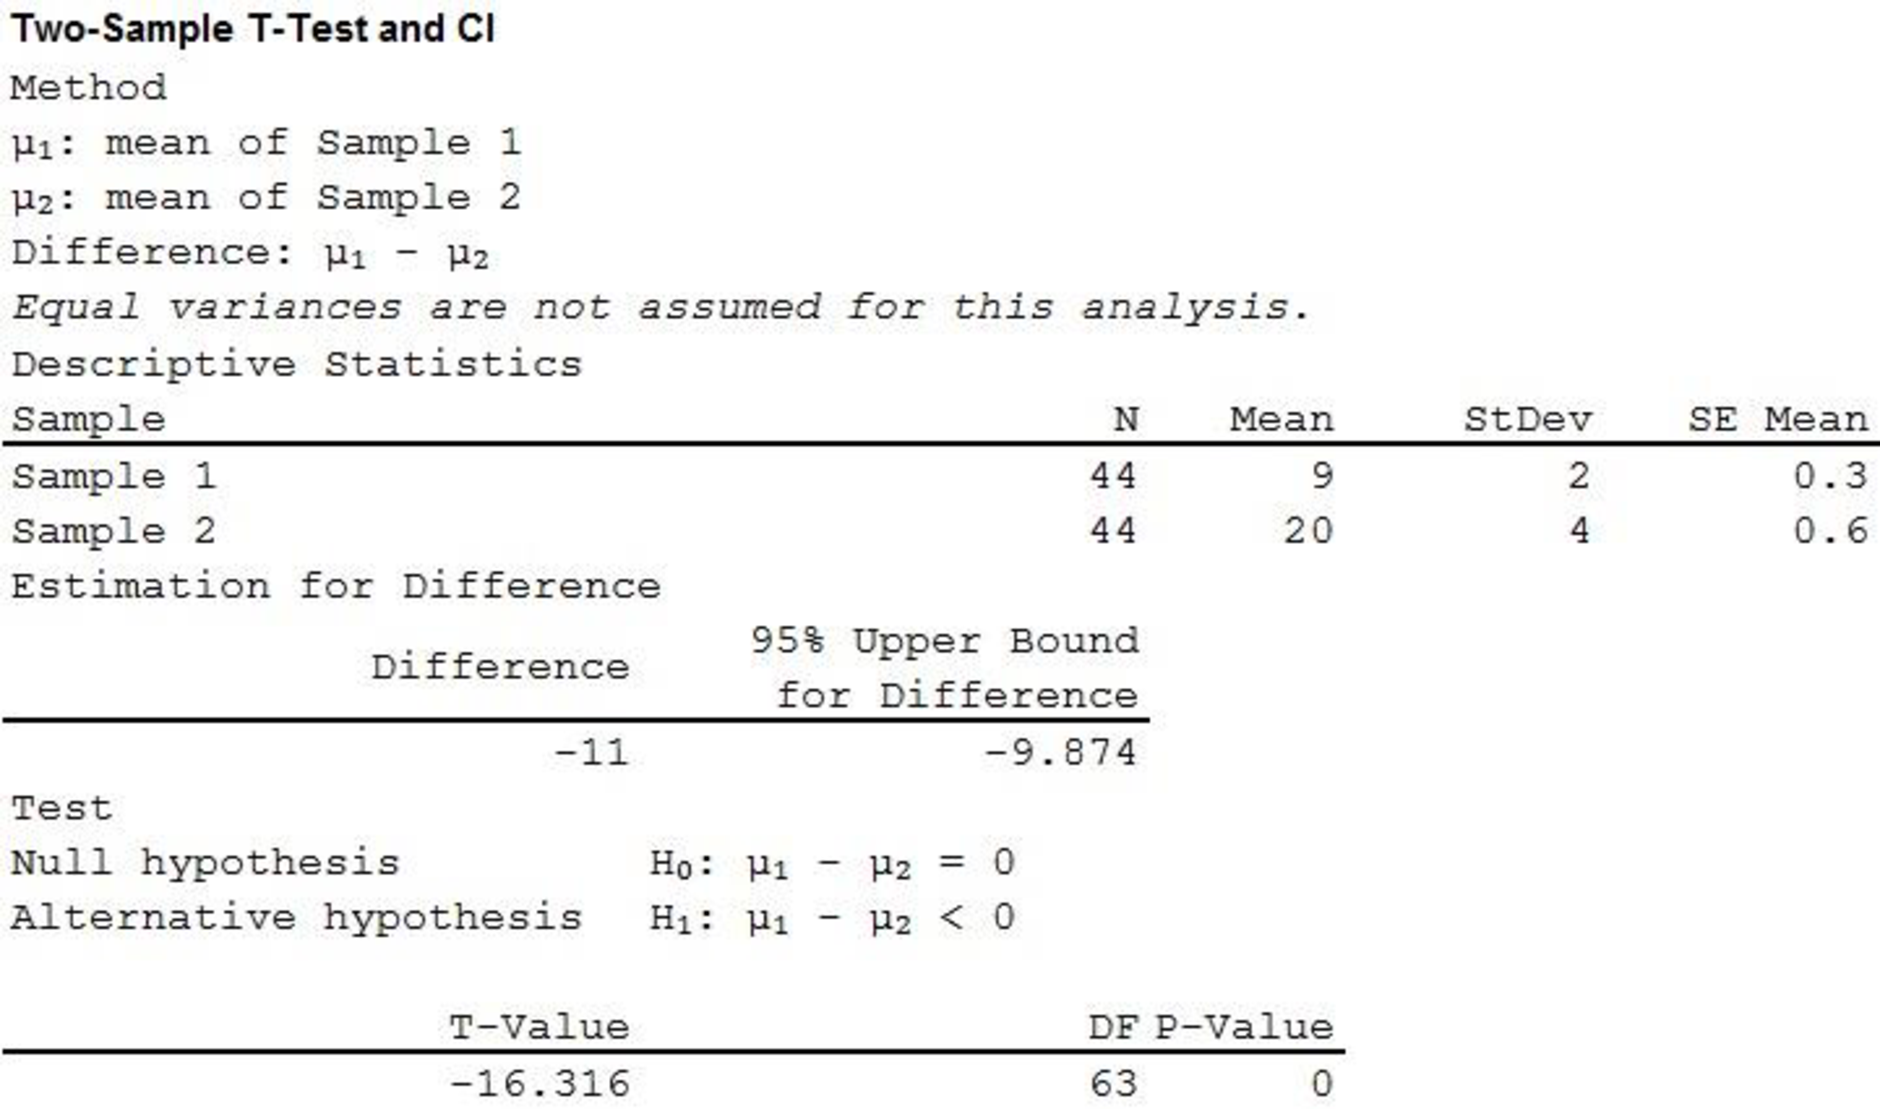
Therefore, the P-value is 0 and the test statistic is –16.316.
Decision rule:
- If P-value is less than or equal to the level of significance, reject the null hypothesis.
- Otherwise fail to reject the null hypothesis.
Conclusion:
Here, the level of significance is 0.05.
Here, P-value is less than the level of significance.
That is,
Therefore, reject the null hypothesis.
Hence, there is proper evidence to support the claim that the mean percentage of time spent playing with doll is greater for female monkeys than for male monkeys.
c.
Check whether mean percentage of time spent playing with furry dog is not the same for female and male monkeys or not.
Answer to Problem 17E
There is convincing evidence that mean percentage of time spent playing with furry dog is not the same for female and male monkeys.
Explanation of Solution
Calculation:
The assumption for the two-sample t-test:
- The random samples should be collected independently.
- The sample sizes should be large. That is, each sample size is at least 30.
The assumptions in this particular problem:
- Two samples of 44 monkeys are selected randomly and independently from the population.
- The sample sizes are large enough.
Here, both sample sizes are equal to 44 and which are greater than 30.
Therefore, the assumptions are satisfied.
Let
Let
Hypotheses:
Null hypothesis:
That is, the mean percentage of time playing with furry dog is same for both male and female monkeys.
Alternative hypothesis:
That is, the mean percentage of time spent playing with furry dog is not the same for female and male monkeys.
Test statistic and P-value:
Software procedure:
Step by step procedure to obtain the P-value and test statistic by using MINITAB software is as follows:
- Choose Stat > Basic Statistics > 2 sample t.
- Choose Summarized data.
- In sample 1, enter Sample size as 44, Mean as 25, Standard deviation as 5.
- In sample 2, enter Sample size as 44, Mean as 20, Standard deviation as 5.
- Choose Options.
- In Confidence level, enter 95.
- In Alternative, select not equal.
- Click OK in all the dialogue boxes.
Output using the MINITAB software is given below:
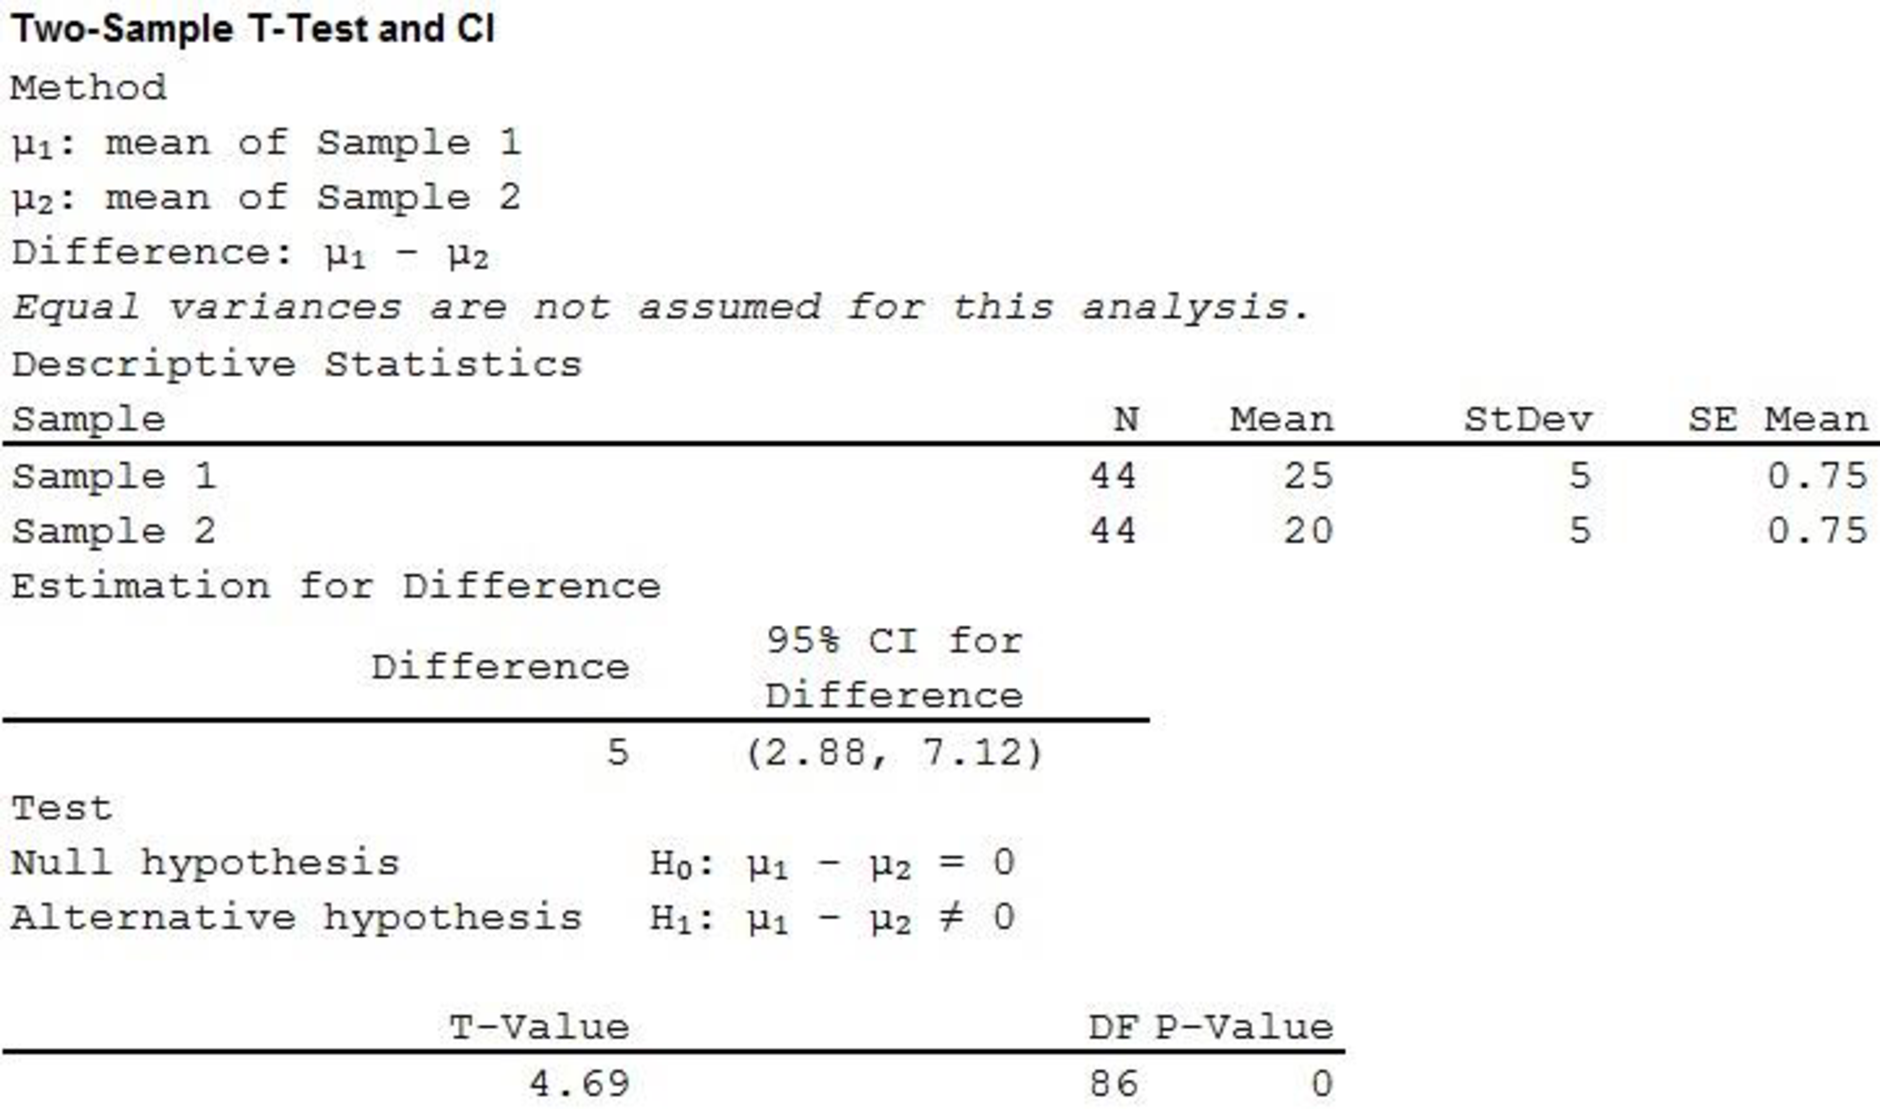
Therefore, the P-value is 0 and the test statistic is 4.690.
Decision rule:
- If P-value is less than or equal to the level of significance, reject the null hypothesis.
- Otherwise fail to reject the null hypothesis.
Conclusion:
Here, the level of significance is 0.05.
Here, P-value is less than the level of significance.
That is,
Therefore, reject the null hypothesis.
Hence, there is proper evidence to support the claim that the mean percentage of time spent playing with furry dog is not the same for female and male monkeys.
d.
Explain whether the newspaper head line a reasonable summary of the findings.
Explanation of Solution
From parts (a), (b), and (c), it is clear that, the male monkeys spent more time with masculine toy than female monkeys, the female monkeys spent more time with feminine toy than male monkeys, mean percentage of time spent playing with neutral toy is not same for female and male monkeys. Therefore the result shows convincing evidence of a gender basis in the monkeys’ choice of how much time to spend playing with three of the toys.
e.
Explain why two sample t test is inappropriate in this situation.
Explanation of Solution
Here, the population under consideration is female monkeys. The mean percentage of time spent playing with the police car and mean time spent playing with the doll is not same for the population. That is samples are taken from the same population. That is, samples are dependent. Two sample t test is appropriate only when samples are independent. Therefore, two sample t test is inappropriate in this situation.
Want to see more full solutions like this?
Chapter 11 Solutions
Bundle: Introduction to Statistics and Data Analysis, 5th + WebAssign Printed Access Card: Peck/Olsen/Devore. 5th Edition, Single-Term


- Suppose that the chance that an elementary student eats hot lunch is 30 percent. What’s the chance that, among 20 randomly selected students, between 6 and 8 students eat hot lunch (inclusive)?arrow_forwardBob’s commuting times to work are varied. He makes it to work on time 80 percent of the time. On 12 randomly selected trips to work, what’s the chance that Bob makes it on time at least 10 times?arrow_forwardYour chance of winning a small prize in a scratch-off ticket is 10 percent. You buy five tickets. What’s the chance you will win at least one prize?arrow_forward
- Suppose that 60 percent of families own a pet. You randomly sample four families. What is the chance that two or three of them own a pet?arrow_forwardIf 40 percent of university students purchase their textbooks online, in a random sample of five students, what’s the chance that exactly one of them purchased their textbooks online?arrow_forwardA stoplight is green 40 percent of the time. If you stop at this light eight random times, what is the chance that it’s green exactly five times?arrow_forward
- If 10 percent of the parts made by a certain company are defective and have to be remade, what is the chance that a random sample of four parts has one that is defective?arrow_forwardQuestion 4 Fourteen individuals were given a complex puzzle to complete. The times in seconds was recorded for their first and second attempts and the results provided below: 1 2 3 first attempt 172 255 second attempt 70 4 5 114 248 218 194 270 267 66 6 7 230 219 341 174 8 10 9 210 261 347 218 200 281 199 308 268 243 236 300 11 12 13 14 140 302 a. Calculate a 95% confidence interval for the mean time taken by each individual to complete the (i) first attempt and (ii) second attempt. [la] b. Test the hypothesis that the difference between the two mean times for both is 100 seconds. Use the 5% level of significance. c. Subsequently, it was learnt that the times for the second attempt were incorrecly recorded and that each of the values is 50 seconds too large. What, if any, difference does this make to the results of the test done in part (b)? Show all steps for the hypothesis testarrow_forwardQuestion 3 3200 students were asked about the importance of study groups in successfully completing their courses. They were asked to provide their current majors as well as their opinion. The results are given below: Major Opinion Psychology Sociology Economics Statistics Accounting Total Agree 144 183 201 271 251 1050 Disagree 230 233 254 227 218 1162 Impartial 201 181 196 234 176 988 Total 575 597 651 732 645 3200 a. State both the null and alternative hypotheses. b. Provide the decision rule for making this decision. Use an alpha level of 5%. c. Show all of the work necessary to calculate the appropriate statistic. | d. What conclusion are you allowed to draw? c. Would your conclusion change at the 10% level of significance? f. Confirm test results in part (c) using JASP. Note: All JASP input files and output tables should be providedarrow_forward
- Question 1 A tech company has acknowledged the importance of having records of all meetings conducted. The meetings are very fast paced and requires equipment that is able to capture the information in the shortest possible time. There are two options, using a typewriter or a word processor. Fifteen administrative assistants are selected and the amount of typing time in hours was recorded. The results are given below: 1 2 3 4 5 6 7 8 9 10 11 12 13 14 15 typewriter 8.0 6.5 5.0 6.7 7.8 8.5 7.2 5.7 9.2 5.7 6.5 word processor 7.2 5.7 8.3 7.5 9.2 7.2 6.5 7.0 6.9 34 7.0 6.9 8.8 6.7 8.8 9.4 8.6 5.5 7.2 8.4 a. Test the hypothesis that the mean typing time in hours for typewriters is less than 7.0. Use the 1% level of significance. b. Construct a 90% confidence interval for the difference in mean typing time in hours, where a difference is equal to the typing time in hours of word processors minus typing time in hours of typewriter. c. Using the 5% significance level, determine whether there is…arrow_forwardIllustrate 2/7×4/5 using a rectangular region. Explain your work. arrow_forwardWrite three other different proportions equivalent to the following using the same values as in the given proportion 3 foot over 1 yard equals X feet over 5 yardsarrow_forward
 Holt Mcdougal Larson Pre-algebra: Student Edition...AlgebraISBN:9780547587776Author:HOLT MCDOUGALPublisher:HOLT MCDOUGAL
 College Algebra (MindTap Course List)AlgebraISBN:9781305652231Author:R. David Gustafson, Jeff HughesPublisher:Cengage Learning
 Glencoe Algebra 1, Student Edition, 9780079039897...AlgebraISBN:9780079039897Author:CarterPublisher:McGraw Hill