Concept explainers
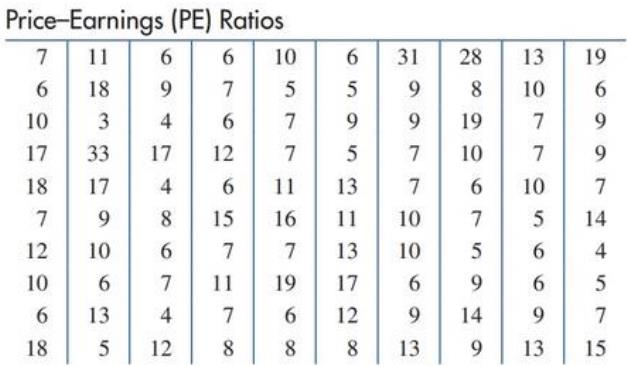
Common stocks. The following table shows price-earnings ratios of

(A) Construct a frequency and relative frequency table using a class interval of
(B) Construct a histogram.
(C) Construct a frequency
(D) Construct a cumulative frequency and relative cumulative frequency table. What is the
probability that a price earnings ratio drawn at random from the sample will fall between
(E) Construct a cumulative frequency polygon.
Want to see the full answer?
Check out a sample textbook solution
Chapter 11 Solutions
Finite Mathematics for Business, Economics, Life Sciences, and Social Sciences (13th Edition)
Additional Math Textbook Solutions
A Problem Solving Approach To Mathematics For Elementary School Teachers (13th Edition)
Introductory Statistics
Calculus: Early Transcendentals (2nd Edition)
A First Course in Probability (10th Edition)
Algebra and Trigonometry (6th Edition)
- Can you help me solve this?arrow_forwardFind a basis and dimension for the null space of the following matrix: 3 -2 0 7 -2 1-1 1 5 3 19-2 8 06 1 -2 -4 -5-6 -9 4-6 11 6 Find a basis and dimension for the column space of the same matrix (above).arrow_forward3. (i) Below is the R code for performing a X2 test on a 2×3 matrix of categorical variables called TestMatrix: chisq.test(Test Matrix) (a) Assuming we have a significant result for this procedure, provide the R code (including any required packages) for an appropriate post hoc test. (b) If we were to apply this technique to a 2 × 2 case, how would we adapt the code in order to perform the correct test? (ii) What procedure can we use if we want to test for association when we have ordinal variables? What code do we use in R to do this? What package does this command belong to? (iii) The following code contains the initial steps for a scenario where we are looking to investigate the relationship between age and whether someone owns a car by using frequencies. There are two issues with the code - please state these. Row3<-c(75,15) Row4<-c(50,-10) MortgageMatrix<-matrix(c(Row1, Row4), byrow=T, nrow=2, MortgageMatrix dimnames=list(c("Yes", "No"), c("40 or older","<40")))…arrow_forward
- Describe the situation in which Fisher’s exact test would be used?(ii) When do we use Yates’ continuity correction (with respect to contingencytables)?[2 Marks] 2. Investigate, checking the relevant assumptions, whether there is an associationbetween age group and home ownership based on the sample dataset for atown below:Home Owner: Yes NoUnder 40 39 12140 and over 181 59Calculate and evaluate the effect size.arrow_forwardsolve these pleasearrow_forwardA factorization A = PDP 1 is not unique. For A= 7 2 -4 1 1 1 5 0 2 1 one factorization is P = D= and P-1 30 = Use this information with D₁ = to find a matrix P₁ such that - -1 -2 0 3 1 - - 1 05 A-P,D,P P1 (Type an integer or simplified fraction for each matrix element.)arrow_forward
- Matrix A is factored in the form PDP 1. Use the Diagonalization Theorem to find the eigenvalues of A and a basis for each eigenspace. 30 -1 - 1 0 -1 400 0 0 1 A= 3 4 3 0 1 3 040 3 1 3 0 0 4 1 0 0 003 -1 0 -1 Select the correct choice below and fill in the answer boxes to complete your choice. (Use a comma to separate vectors as needed.) A basis for the corresponding eigenspace is { A. There is one distinct eigenvalue, λ = B. In ascending order, the two distinct eigenvalues are λ₁ ... = and 2 = Bases for the corresponding eigenspaces are { and ( ), respectively. C. In ascending order, the three distinct eigenvalues are λ₁ = = 12/2 = and 3 = Bases for the corresponding eigenspaces are {}, }, and { respectively.arrow_forwardN Page 0.6. 0.4. 0.2- -0.2- -0.4- -6.6 -5 W 10arrow_forwardDiagonalize the following matrix, if possible. 8 0 6 - 8 Select the correct choice below and, if necessary, fill in the answer box to complete your choice. 8 0 OA. For P= D= 0 3 6 0 B. For P = D= 0 -6 8 0 C. For P = D= 0 - 8 D. The matrix cannot be diagonalized.arrow_forward
 Big Ideas Math A Bridge To Success Algebra 1: Stu...AlgebraISBN:9781680331141Author:HOUGHTON MIFFLIN HARCOURTPublisher:Houghton Mifflin Harcourt
 Holt Mcdougal Larson Pre-algebra: Student Edition...AlgebraISBN:9780547587776Author:HOLT MCDOUGALPublisher:HOLT MCDOUGAL
 Glencoe Algebra 1, Student Edition, 9780079039897...AlgebraISBN:9780079039897Author:CarterPublisher:McGraw Hill


