Elevation vs. Distance The following graph, obtained from GPS data, shows the elevation of a hiker as a function of the distance d from the starting point of the trail. a. Find the slope of the secant line that passes through points A and B . Interpret your answer as an average rate of change over the interval 1 ≤ d ≤ 3. b. Repeat the procedure outlined in part (a) for the secant line that passes through points P and Q c. Notice that the elevation function is nearly constant over the segment of the trail from mile d = 4.5 to mile d = 5. Give a plausible explanation for the horizontal line segment.
Elevation vs. Distance The following graph, obtained from GPS data, shows the elevation of a hiker as a function of the distance d from the starting point of the trail. a. Find the slope of the secant line that passes through points A and B . Interpret your answer as an average rate of change over the interval 1 ≤ d ≤ 3. b. Repeat the procedure outlined in part (a) for the secant line that passes through points P and Q c. Notice that the elevation function is nearly constant over the segment of the trail from mile d = 4.5 to mile d = 5. Give a plausible explanation for the horizontal line segment.
Solution Summary: The author explains the slope of the secant line passing through the points A and B and interprets the answer as an average rate of change over the interval.
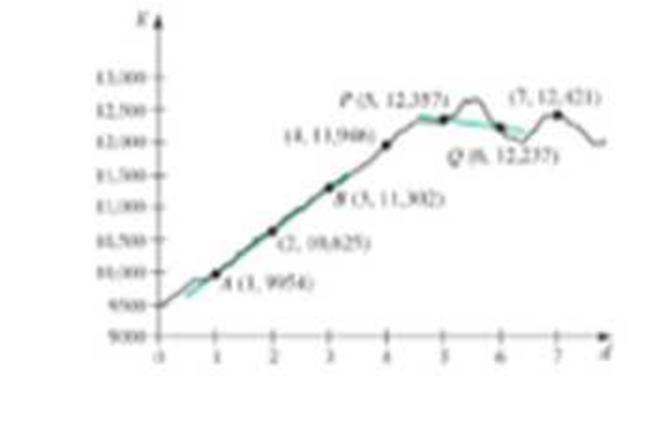
Elevation vs. Distance The following graph, obtained from GPS data, shows the elevation of a hiker as a function of the distance d from the starting point of the trail.
a. Find the slope of the secant line that passes through points A and B. Interpret your answer as an average rate of change over the interval 1 ≤ d ≤ 3.
b. Repeat the procedure outlined in part (a) for the secant line that passes through points P and Q
c. Notice that the elevation function is nearly constant over the segment of the trail from mile d = 4.5 to mile d = 5. Give a plausible explanation for the horizontal line segment.
Draw the vertical and horizontal asymptotes. Then plot the intercepts (if any), and plot at least one point on each side of each vertical asymptote.
Draw the asymptotes (if there are any). Then plot two points on each piece of the graph.
Chapter 1 Solutions
Single Variable Calculus: Early Transcendentals, Books a la Carte, and MyLab Math with Pearson eText -- Title-Specific Access Card Package (3rd Edition)
Need a deep-dive on the concept behind this application? Look no further. Learn more about this topic, calculus and related others by exploring similar questions and additional content below.


 Algebra & Trigonometry with Analytic GeometryAlgebraISBN:9781133382119Author:SwokowskiPublisher:Cengage
 Glencoe Algebra 1, Student Edition, 9780079039897...AlgebraISBN:9780079039897Author:CarterPublisher:McGraw Hill
 College Algebra (MindTap Course List)AlgebraISBN:9781305652231Author:R. David Gustafson, Jeff HughesPublisher:Cengage Learning
 Algebra: Structure And Method, Book 1AlgebraISBN:9780395977224Author:Richard G. Brown, Mary P. Dolciani, Robert H. Sorgenfrey, William L. ColePublisher:McDougal Littell
 Algebra and Trigonometry (MindTap Course List)AlgebraISBN:9781305071742Author:James Stewart, Lothar Redlin, Saleem WatsonPublisher:Cengage Learning
 College AlgebraAlgebraISBN:9781305115545Author:James Stewart, Lothar Redlin, Saleem WatsonPublisher:Cengage Learning