
Concept explainers
Videos
Introduction:
Scientists study family history using a diagram that traces inheritance of a particular trait through several generations. Such diagrams are called pedigree. A pedigree uses symbols to illustrate the inheritance of trait. By analyzing the pedigree we can infer the genotypes by observing the
Answer to Problem 5A
Correct answer :
The correct answer is option D. Huntington’s disease
Explanation of Solution
Explanation/justification for the correct answer:
Option D. Huntington’s disease - The given pedigree illustrates inheritance of a rare genetic disorder. In this diagram, some express the disease and some do not have the disease. There are no circles or squares which are half filled; so there are no carriers of the disease. Hence we can say that the disorder is a dominant genetic disorder because a recessive genetic disorder will have a carrier. Amongst the diseases given only Huntington’s disease is a dominant genetic disease. The other three are recessive genetic disorders.
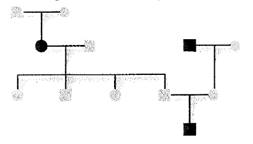
Hence this is the correct option.
Explanation for incorrect answer:
Option A. cystic fibrosis- It is a recessive genetic disorder. Since the given pedigree does not show any carrier of the disease, it may be concluded that the pedigree shows a dominant genetic disorder. Hence this is not the correct option.
Option B. albinism- It is a recessive genetic disorder. Since the given pedigree does not show any carrier of the disease, it may be concluded that the pedigree shows a dominant genetic disorder. Hence this is not the correct option.
Option C. Tay-Sachs disease- It is a recessive genetic disorder. Since the given pedigree does not show any carrier of the disease, it may be concluded that the pedigree shows a dominant genetic disorder. Hence this is not the correct option.
Chapter 11 Solutions
EP BIOLOGY 2012-STUDENTWORKS ONLINE
Additional Science Textbook Solutions
Campbell Essential Biology (7th Edition)
Introductory Chemistry (6th Edition)
Chemistry: A Molecular Approach (4th Edition)
Chemistry: An Introduction to General, Organic, and Biological Chemistry (13th Edition)
Applications and Investigations in Earth Science (9th Edition)
Human Physiology: An Integrated Approach (8th Edition)


- If using animals in medical experiments could save human lives, is it ethical to do so? In your answer, apply at least one ethical theory in support of your position.arrow_forwardYou aim to test the hypothesis that the Tbx4 and Tbx5 genes inhibit each other's expression during limb development. With access to chicken embryos and viruses capable of overexpressing Tbx4 and Tbx5, describe an experiment to investigate whether these genes suppress each other's expression in the limb buds. What results would you expect if they do repress each other? What results would you expect if they do not repress each other?arrow_forwardYou decide to delete Fgf4 and Fgf8 specifically in the limb bud. Explain why you would not knock out these genes in the entire embryo instead.arrow_forward
- You implant an FGF10-coated bead into the anterior flank of a chicken embryo, directly below the level of the wing bud. What is the phenotype of the resulting ectopic limb? Briefly describe the expected expression domains of 1) Shh, 2) Tbx4, and 3) Tbx5 in the resulting ectopic limb bud.arrow_forwardDesign a grafting experiment to determine if limb mesoderm determines forelimb / hindlimb identity. Include the experiment, a control, and an interpretation in your answer.arrow_forwardThe Snapdragon is a popular garden flower that comes in a variety of colours, including red, yellow, and orange. The genotypes and associated phenotypes for some of these flowers are as follows: aabb: yellow AABB, AABb, AaBb, and AaBB: red AAbb and Aabb: orange aaBB: yellow aaBb: ? Based on this information, what would the phenotype of a Snapdragon with the genotype aaBb be and why? Question 21 options: orange because A is epistatic to B yellow because A is epistatic to B red because B is epistatic to A orange because B is epistatic to A red because A is epistatic to B yellow because B is epistatic to Aarrow_forward
- A sample of blood was taken from the above individual and prepared for haemoglobin analysis. However, when water was added the cells did not lyse and looked normal in size and shape. The technician suspected that they had may have made an error in the protocol – what is the most likely explanation? The cell membranes are more resistant than normal. An isotonic solution had been added instead of water. A solution of 0.1 M NaCl had been added instead of water. Not enough water had been added to the red blood cell pellet. The man had sickle-cell anaemia.arrow_forwardA sample of blood was taken from the above individual and prepared for haemoglobin analysis. However, when water was added the cells did not lyse and looked normal in size and shape. The technician suspected that they had may have made an error in the protocol – what is the most likely explanation? The cell membranes are more resistant than normal. An isotonic solution had been added instead of water. A solution of 0.1 M NaCl had been added instead of water. Not enough water had been added to the red blood cell pellet. The man had sickle-cell anaemia.arrow_forwardWith reference to their absorption spectra of the oxy haemoglobin intact line) and deoxyhemoglobin (broken line) shown in Figure 2 below, how would you best explain the reason why there are differences in the major peaks of the spectra? Figure 2. SPECTRA OF OXYGENATED AND DEOXYGENATED HAEMOGLOBIN OBTAINED WITH THE RECORDING SPECTROPHOTOMETER 1.4 Abs < 0.8 06 0.4 400 420 440 460 480 500 520 540 560 580 600 nm 1. The difference in the spectra is due to a pH change in the deoxy-haemoglobin due to uptake of CO2- 2. There is more oxygen-carrying plasma in the oxy-haemoglobin sample. 3. The change in Mr due to oxygen binding causes the oxy haemoglobin to have a higher absorbance peak. 4. Oxy-haemoglobin is contaminated by carbaminohemoglobin, and therefore has a higher absorbance peak 5. Oxy-haemoglobin absorbs more light of blue wavelengths and less of red wavelengths than deoxy-haemoglobinarrow_forward
 Human Anatomy & Physiology (11th Edition)BiologyISBN:9780134580999Author:Elaine N. Marieb, Katja N. HoehnPublisher:PEARSON
 Biology 2eBiologyISBN:9781947172517Author:Matthew Douglas, Jung Choi, Mary Ann ClarkPublisher:OpenStax
 Anatomy & PhysiologyBiologyISBN:9781259398629Author:McKinley, Michael P., O'loughlin, Valerie Dean, Bidle, Theresa StouterPublisher:Mcgraw Hill Education,
 Molecular Biology of the Cell (Sixth Edition)BiologyISBN:9780815344322Author:Bruce Alberts, Alexander D. Johnson, Julian Lewis, David Morgan, Martin Raff, Keith Roberts, Peter WalterPublisher:W. W. Norton & Company
 Laboratory Manual For Human Anatomy & PhysiologyBiologyISBN:9781260159363Author:Martin, Terry R., Prentice-craver, CynthiaPublisher:McGraw-Hill Publishing Co.
 Inquiry Into Life (16th Edition)BiologyISBN:9781260231700Author:Sylvia S. Mader, Michael WindelspechtPublisher:McGraw Hill Education