Concept explainers
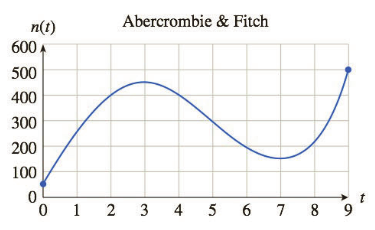
Net Income: Casual Apparel In the following graph,

a. Estimate
b. At approximately which value of t in the interval
c. At approximately which value of t in the interval
Trending nowThis is a popular solution!

Chapter 1 Solutions
Finite Mathematics, Loose-leaf Version
- PROBLEM 7: Binary Relations, Functions and Orderings (15 pts) 1. (2 pts) Prove that ({2, 3, 4, 6, 24, 36, 72}, /) is a poset, create its corresponding Hasse diagram and identify maximal and minimal elements. 2. (1 pts) Prove that (P{1, 2, 3}, C) is a poset, create its corresponding Hasse diagram and identify maximal and minimal elements 3. Assume the following mapping, captured by variable map: map = { 72 {1,2,3}, 36 {3}, 24 {1,2}, 6- → {3}, 4 {1,3}, 2➡ {} } Provide answers to the following in detail (in plain english and formally): (a) (2 pts) Is variable map a function? If so, is it a total or a partial function? Identify domain and codomain. (b) (10 pts) Discuss all properties (injectivity, surjectivity, bijection, order preserving, order reflecting, order embedding, isomorphism). NOTE: When we reason formally on a property we must state: (1) What Law do we expect to hold or not hold, and (2) Does this Law indeed hold or Is this Law violated?arrow_forwardI need help with this problem and an explanation of the solution for the image described below. (Statistics: Engineering Probabilities)arrow_forwardI need help with this problem and an explanation of the solution for the image described below. (Statistics: Engineering Probabilities)arrow_forward
- DATA TABLE VALUES Meal Price ($) 22.78 31.90 33.89 22.77 18.04 23.29 35.28 42.38 36.88 38.55 41.68 25.73 34.19 31.75 25.24 26.32 19.57 36.57 32.97 36.83 30.17 37.29 25.37 24.71 28.79 32.83 43.00 35.23 34.76 33.06 27.73 31.89 38.47 39.42 40.72 43.92 36.51 45.25 33.51 29.17 30.54 26.74 37.93arrow_forwardI need help with this problem and an explanation of the solution for the image described below. (Statistics: Engineering Probabilities)arrow_forwardQuestion 4 Find an equation of (a) The plane through the point (2, 0, 1) and perpendicular to the line x = y=2-t, z=3+4t. 3t, (b) The plane through the point (3, −2, 8) and parallel to the plane z = x+y. (c) The plane that contains the line x = 1+t, y = 2 − t, z = 4 - 3t and is parallel to the plane 5x + 2y + z = 1. (d) The plane that passes through the point (1,2,3) and contains the line x = 3t, y = 1+t, and z = 2-t. (e) The plane that contains the lines L₁: x = 1 + t, y = 1 − t, z = 2t and L2 : x = 2 − s, y = s, z = 2.arrow_forward
- Please find all values of x.arrow_forwardSales personnel for Skillings Distributors submit weekly reports listing the customer contacts made during the week. A sample of 65 weekly reports showed a sample mean of 19.5 customer contacts per week. The sample standard deviation was 5.2. Provide 90% and 95% confidence intervals for the population mean number of weekly customer contacts for the sales personnel. 90% Confidence interval, to 2 decimals: ( , ) 95% Confidence interval, to 2 decimals:arrow_forwardA simple random sample of 40 items resulted in a sample mean of 25. The population standard deviation is 5. a. What is the standard error of the mean (to 2 decimals)? b. At 95% confidence, what is the margin of error (to 2 decimals)?arrow_forward
- mean trough level of the population to be 3.7 micrograms/mL. The researcher conducts a study among 93 newly diagnosed arthritis patients and finds the mean trough to be 4.1 micrograms/mL with a standard deviation of 2.4 micrograms/mL. The researcher wants to test at the 5% level of significance if the trough is different than previously reported or not. Z statistics will be used. Complete Step 5 of hypothesis testing: Conclusion. State whether or not you would reject the null hypothesis and why. Also interpret what this means (i.e. is the mean trough different from 3.7 or noarrow_forwardQ15arrow_forwardMathematical Statistics: I ended up having 2.306 as my t-distrubtion but I'm not sure how to find the length.arrow_forward
- Algebra & Trigonometry with Analytic GeometryAlgebraISBN:9781133382119Author:SwokowskiPublisher:Cengage

 Trigonometry (MindTap Course List)TrigonometryISBN:9781337278461Author:Ron LarsonPublisher:Cengage Learning
  Glencoe Algebra 1, Student Edition, 9780079039897...AlgebraISBN:9780079039897Author:CarterPublisher:McGraw Hill
 Algebra: Structure And Method, Book 1AlgebraISBN:9780395977224Author:Richard G. Brown, Mary P. Dolciani, Robert H. Sorgenfrey, William L. ColePublisher:McDougal Littell
 Elementary Linear Algebra (MindTap Course List)AlgebraISBN:9781305658004Author:Ron LarsonPublisher:Cengage Learning


