
Intro Stats, Books a la carte Plus NEW MyLab Statistics with Pearson eText -- Access Card Package (5th Edition)
5th Edition
ISBN: 9780134210247
Author: Richard D. De Veaux, Paul Velleman, David E. Bock
Publisher: PEARSON
expand_more
expand_more
format_list_bulleted
Videos
Textbook Question
Chapter 11, Problem 48E
Contrast baths Contrast bath treatments use the immersion of an injured limb alternately in water of two contrasting temperatures. Those who use the method claim that it can reduce swelling. Researchers compared three treatments: (1) contrast baths and exercise, (2) contrast baths alone, and (3) exercise alone. (R. G. Janssen, D. A. Schwartz, and P. F. Velleman, “A Randomized Controlled Study of Contrast Baths on Patients with Carpal Tunnel Syndrome,” Journal of Hand Therapy, 2009) They report the following boxplots comparing the change in hand volume after treatment:
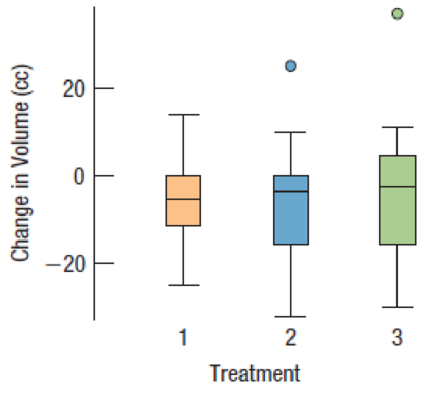
- a) The researchers conclude that the differences were not statistically significant. Explain what that means in context.
- b) The title says that the study was randomized and controlled. Explain what that probably means for this study.
- c) The study did not use a placebo treatment. What was done instead? Do you think that was an appropriate choice? Explain.
Expert Solution & Answer
Want to see the full answer?
Check out a sample textbook solution
Students have asked these similar questions
An Arts group holds a raffle. Each raffle ticket costs $2 and the raffle consists of 2500 tickets. The prize is a vacation worth $3,000.
a. Determine your expected value if you buy one ticket.
b. Determine your expected value if you buy five tickets.
How much will the Arts group gain or lose if they sell all the tickets?
Please show as much work as possible to clearly show the steps you used to find each solution. If you plan to use a calculator, please be sure to clearly indicate your strategy.
Consider the following game. It costs $3 each time you roll a six-sided number cube. If you roll a 6 you win $15. If you roll any other number, you receive nothing.
a) Find the expected value of the game.
b) If you play this game many times, will you expect to gain or lose money?
=
12:02
WeBWorK / 2024 Fall Rafeek MTH23 D02
/ 9.2 Testing the Mean mu / 3
38
WEBWORK
Previous Problem
Problem List
Next Problem
9.2 Testing the Mean mu:
Problem 3
(1 point)
Test the claim that the population of sophomore college
students has a mean grade point average greater than 2.2.
Sample statistics include n = 71, x = 2.44, and s = 0.9.
Use a significance level of a = 0.01.
The test statistic is
The P-Value is between :
The final conclusion is
< P-value <
A. There is sufficient evidence to support the claim that
the mean grade point average is greater than 2.2.
○ B. There is not sufficient evidence to support the claim
that the mean grade point average is greater than 2.2.
Note: You can earn partial credit on this problem.
Note: You are in the Reduced Scoring Period. All work counts for
50% of the original.
Preview My Answers Submit Answers
You have attempted this problem 0 times.
You have unlimited attempts remaining.
.
Oli
wwm01.bcc.cuny.edu
Chapter 11 Solutions
Intro Stats, Books a la carte Plus NEW MyLab Statistics with Pearson eText -- Access Card Package (5th Edition)
Ch. 11.3 - At one time, a method called gastric freezing was...Ch. 11.4 - Recall the experiment about gastric freezing, an...Ch. 11 - Steroids The 1990s and early 2000s could be...Ch. 11 - Prob. 2ECh. 11 - Prob. 3ECh. 11 - Tomatoes You want to compare the tastiness and...Ch. 11 - Tips II For the experiment described in Exercise...Ch. 11 - Prob. 6ECh. 11 - Prob. 7ECh. 11 - Prob. 8E
Ch. 11 - Prob. 9ECh. 11 - Prob. 10ECh. 11 - Block that tip The driver of Exercise 3 wants to...Ch. 11 - Blocking tomatoes To obtain enough plants for the...Ch. 11 - Prob. 13ECh. 11 - Prob. 14ECh. 11 - Standardized test scores For his statistics class...Ch. 11 - Heart attacks and height Researchers who examined...Ch. 11 - Prob. 17ECh. 11 - Prob. 18ECh. 11 - Menopause Researchers studied the herb black...Ch. 11 - Honesty Coffee stations in offices often just ask...Ch. 11 - 2134. Whats the design? Read each brief report of...Ch. 11 - 2134. Whats the design? Read each brief report of...Ch. 11 - 2134. Whats the design? Read each brief report of...Ch. 11 - 2134. Whats the design? Read each brief report of...Ch. 11 - 2134. Whats the design? Read each brief report of...Ch. 11 - 2134. Whats the design? Read each brief report of...Ch. 11 - 2134. Whats the design? Read each brief report of...Ch. 11 - 2134. Whats the design? Read each brief report of...Ch. 11 - 2134. Whats the design? Read each brief report of...Ch. 11 - 2134. Whats the design? Read each brief report of...Ch. 11 - 2134. Whats the design? Read each brief report of...Ch. 11 - 2134. Whats the design? Read each brief report of...Ch. 11 - 2134. Whats the design? Read each brief report of...Ch. 11 - 2134. Whats the design? Read each brief report of...Ch. 11 - Omega-3 Exercise 21 describes an experiment that...Ch. 11 - Insomnia Exercise 24 describes an experiment...Ch. 11 - Omega-3, revisited Exercises 21 and 35 describe an...Ch. 11 - Insomnia, again Exercises 24 and 36 describe an...Ch. 11 - Omega-3, finis Exercises 21, 35, and 37 describe...Ch. 11 - Insomnia, at last Exercises 24, 36, and 38...Ch. 11 - Injuries Exercise 33 describes an experiment that...Ch. 11 - Tomatoes II Describe a strategy to randomly split...Ch. 11 - Shoes A running-shoe manufacturer wants to test...Ch. 11 - Swimsuits A swimsuit manufacturer wants to test...Ch. 11 - Hamstrings Exercise 33 discussed an experiment to...Ch. 11 - Diet and blood pressure An experiment showed that...Ch. 11 - Mozart Will listening to a Mozart piano sonata...Ch. 11 - Contrast baths Contrast bath treatments use the...Ch. 11 - Wine A Danish study published in the Archives of...Ch. 11 - Swimming Recently, a group of adults who swim...Ch. 11 - Dowsing Before drilling for water, many rural...Ch. 11 - Healing A medical researcher suspects that giving...Ch. 11 - Reading Some schools teach reading using phonics...Ch. 11 - Gas mileage Do cars get better gas mileage with...Ch. 11 - Weekend deaths A study published in the New...Ch. 11 - Shingles A research doctor has discovered a new...Ch. 11 - Beetles Hoping to learn how to control crop damage...Ch. 11 - SAT prep Can special study courses actually help...Ch. 11 - Safety switch An industrial machine requires an...Ch. 11 - Washing clothes A consumer group wants to test the...Ch. 11 - Skydiving, anyone? A humor piece published in the...
Knowledge Booster


Learn more about
Need a deep-dive on the concept behind this application? Look no further. Learn more about this topic, statistics and related others by exploring similar questions and additional content below.Similar questions
- There are four white, fourteen blue and five green marbles in a bag. A marble is selected from the bag without looking. Find the odds of the following: The odds against selecting a green marble. The odds in favour of not selecting a green marble The odds in favor of the marble selected being either a white or a blue marble. What is true about the above odds? Explainarrow_forwardPlease show as much work as possible to clearly show the steps you used to find each solution. If you plan to use a calculator, please be sure to clearly indicate your strategy. 1. The probability of a soccer game in a particular league going into overtime is 0.125. Find the following: a. The odds in favour of a game going into overtime. b. The odds in favour of a game not going into overtime. c. If the teams in the league play 100 games in a season, about how many games would you expect to go into overtime?arrow_forwardexplain the importance of the Hypothesis test in a business setting, and give an example of a situation where it is helpful in business decision making.arrow_forward
- A college wants to estimate what students typically spend on textbooks. A report fromthe college bookstore observes that textbooks range in price from $22 to $186. Toobtain a 95% confidence level for a confidence interval estimate to plus or minus $10,how many students should the college survey? (We may estimate the populationstandard deviation as (range) ÷ 4.)arrow_forwardIn a study of how students give directions, forty volunteers were given the task ofexplaining to another person how to reach a destination. Researchers measured thefollowing five aspects of the subjects’ direction-giving behavior:• whether a map was available or if directions were given from memory without a map,• the gender of the direction-giver,• the distances given as part of the directions,• the number of times directions such as “north” or “left” were used,• the frequency of errors in directions. Identify each of the variables in this study, and whether each is quantitative orqualitative. For each quantitative variable, state whether it is discrete or continuous. Was this an observational study or an experimental study? Explain your answer.arrow_forwardexplain the difference between the confident interval and the confident level. provide an example to show how to correctly interpret a confidence interval.arrow_forward
- Sketch to scale the orbit of Earth about the sun. Graph Icarus’ orbit on the same set of axesWhile the sun is the center of Earth’s orbit, it is a focus of Icarus’ orbit. There aretwo points of intersection on the graph. Based on the graph, what is the approximate distance between the two points of intersection (in AU)?arrow_forwardThe diameters of ball bearings are distributed normally. The mean diameter is 67 millimeters and the standard deviation is 3 millimeters. Find the probability that the diameter of a selected bearing is greater than 63 millimeters. Round to four decimal places.arrow_forwardSuppose you like to keep a jar of change on your desk. Currently, the jar contains the following: 22 Pennies 27 Dimes 9 Nickels 30 Quarters What is the probability that you reach into the jar and randomly grab a penny and then, without replacement, a dime? Express as a fraction or a decimal number rounded to four decimal places.arrow_forward
- A box contains 14 large marbles and 10 small marbles. Each marble is either green or white. 9 of the large marbles are green, and 4 of the small marbles are white. If a marble is randomly selected from the box, what is the probability that it is small or white? Express as a fraction or a decimal number rounded to four decimal places.arrow_forwardCan I get help with this step please? At a shooting range, instructors can determine if a shooter is consistently missing the target because of the gun sight or because of the shooter's ability. If a gun's sight is off, the variance of the distances between the shots and the center of the shot pattern will be small (even if the shots are not in the center of the target). A student claims that it is the sight that is off, not his aim, and wants the instructor to confirm his claim. If a skilled shooter fires a gun at a target multiple times, the distances between the shots and the center of the shot pattern, measured in centimeters (cm), will have a variance of less than 0.33. After the student shoots 28 shots at the target, the instructor calculates that the distances between his shots and the center of the shot pattern, measured in cm, have a variance of 0.25. Does this evidence support the student's claim that the gun's sight is off? Use a 0.025 level of significance. Assume that the…arrow_forwardThe National Academy of Science reported that 38% of research in mathematics is published by US authors. The mathematics chairperson of a prestigious university wishes to test the claim that this percentage is no longer 38%. He has no indication of whether the percentage has increased or decreased since that time. He surveys a simple random sample of 279 recent articles published by reputable mathematics research journals and finds that 123 of these articles have US authors. Does this evidence support the mathematics chairperson's claim that the percentage is no longer 38 % ? Use a 0.02 level of significance. Compute the value of the test statistic. Round to two decimal places.arrow_forward
arrow_back_ios
SEE MORE QUESTIONS
arrow_forward_ios
Recommended textbooks for you
 MATLAB: An Introduction with ApplicationsStatisticsISBN:9781119256830Author:Amos GilatPublisher:John Wiley & Sons Inc
 Probability and Statistics for Engineering and th...StatisticsISBN:9781305251809Author:Jay L. DevorePublisher:Cengage Learning
 Statistics for The Behavioral Sciences (MindTap C...StatisticsISBN:9781305504912Author:Frederick J Gravetter, Larry B. WallnauPublisher:Cengage Learning
 Elementary Statistics: Picturing the World (7th E...StatisticsISBN:9780134683416Author:Ron Larson, Betsy FarberPublisher:PEARSON
 The Basic Practice of StatisticsStatisticsISBN:9781319042578Author:David S. Moore, William I. Notz, Michael A. FlignerPublisher:W. H. Freeman
 Introduction to the Practice of StatisticsStatisticsISBN:9781319013387Author:David S. Moore, George P. McCabe, Bruce A. CraigPublisher:W. H. Freeman
MATLAB: An Introduction with Applications
Statistics
ISBN:9781119256830
Author:Amos Gilat
Publisher:John Wiley & Sons Inc
Probability and Statistics for Engineering and th...
Statistics
ISBN:9781305251809
Author:Jay L. Devore
Publisher:Cengage Learning
Statistics for The Behavioral Sciences (MindTap C...
Statistics
ISBN:9781305504912
Author:Frederick J Gravetter, Larry B. Wallnau
Publisher:Cengage Learning
Elementary Statistics: Picturing the World (7th E...
Statistics
ISBN:9780134683416
Author:Ron Larson, Betsy Farber
Publisher:PEARSON
The Basic Practice of Statistics
Statistics
ISBN:9781319042578
Author:David S. Moore, William I. Notz, Michael A. Fligner
Publisher:W. H. Freeman
Introduction to the Practice of Statistics
Statistics
ISBN:9781319013387
Author:David S. Moore, George P. McCabe, Bruce A. Craig
Publisher:W. H. Freeman
Hypothesis Testing using Confidence Interval Approach; Author: BUM2413 Applied Statistics UMP;https://www.youtube.com/watch?v=Hq1l3e9pLyY;License: Standard YouTube License, CC-BY
Hypothesis Testing - Difference of Two Means - Student's -Distribution & Normal Distribution; Author: The Organic Chemistry Tutor;https://www.youtube.com/watch?v=UcZwyzwWU7o;License: Standard Youtube License