
Intro Stats
4th Edition
ISBN: 9780321826275
Author: Richard D. De Veaux
Publisher: PEARSON
expand_more
expand_more
format_list_bulleted
Videos
Textbook Question
Chapter 11, Problem 47E
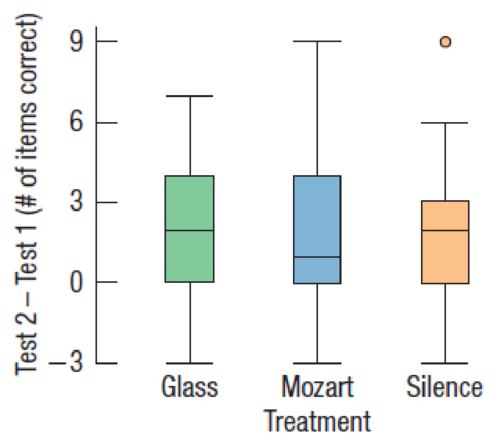
Mozart Will listening to a Mozart piano sonata make you smarter? In a study published in the journal Psychological Science, Rauscher, Shaw, and Ky reported that when students were given a spatial reasoning section of a standard IQ test, those who listened to Mozart for 10 minutes improved their scores more than those who simply sat quietly.
- a) These researchers said the differences were statistically significant. Explain what that means in context.
- b) Steele, Bass, and Crook tried to replicate the original study. In their study, also published in Psychological Science, the subjects were 125 college students who participated in the experiment for course credit. Subjects first took the test. Then they were assigned to one of three groups: listening to a Mozart piano sonata, listening to music by Philip Glass, and sitting for 10 minutes in silence. Three days after the treatments, they were retested. Draw a diagram displaying the design of this experiment.
- c) These boxplots show the differences in score before and after treatment for the three groups. Did the Mozart group show improvement?
- d) Do you think the results prove that listening to Mozart is beneficial? Explain.
Expert Solution & Answer
Want to see the full answer?
Check out a sample textbook solution
Students have asked these similar questions
Techniques QUAT6221 2025 PT B...
TM
Tabudi Maphoru
Activities Assessments Class Progress lIE Library • Help v
The table below shows the prices (R) and quantities (kg) of rice, meat and potatoes items bought during 2013 and 2014:
2013
2014
P1Qo
PoQo
Q1Po P1Q1
Price
Ро
Quantity
Qo
Price
P1
Quantity
Q1
Rice
7
80
6
70
480
560
490
420
Meat
30
50
35
60
1 750
1 500
1 800
2 100
Potatoes
3
100
3
100
300
300
300
300
TOTAL
40
230
44
230
2 530
2 360
2 590
2 820
Instructions:
1 Corall dawn to tha bottom of thir ceraan urina se se tha haca nariad in archerca antarand cubmit
Q Search
ENG US
口X
2025/05
The table below indicates the number of years of experience of a sample of employees who work on a particular production line and the corresponding number of units of a good that each employee produced last month.
Years of Experience (x)
Number of Goods (y)
11
63
5
57
1
48
4
54
45
3
51
Q.1.1 By completing the table below and then applying the relevant formulae, determine the line of best fit for this bivariate data set.
Do NOT change the units for the variables.
X
y
X2
xy
Ex=
Ey=
EX2
EXY=
Q.1.2 Estimate the number of units of the good that would have been produced last month by an employee with 8 years of experience.
Q.1.3 Using your calculator, determine the coefficient of correlation for the data set.
Interpret your answer.
Q.1.4 Compute the coefficient of determination for the data set.
Interpret your answer.
Q.3.2 A sample of consumers was asked to name their favourite fruit. The results regarding the popularity of the different fruits are given in the following table.
Type of Fruit
Number of Consumers
Banana
25
Apple
20
Orange
5
TOTAL
50
Draw a bar chart to graphically illustrate the results given in the table.
Chapter 11 Solutions
Intro Stats
Ch. 11.3 - At one time, a method called gastric freezing was...Ch. 11.4 - Recall the experiment about gastric freezing, an...Ch. 11 - Steroids The 1990s and early 2000s could be...Ch. 11 - Prob. 2ECh. 11 - Prob. 3ECh. 11 - Tomatoes You want to compare the tastiness and...Ch. 11 - Tips II For the experiment described in Exercise...Ch. 11 - Prob. 6ECh. 11 - Prob. 7ECh. 11 - Prob. 8E
Ch. 11 - Prob. 9ECh. 11 - Prob. 10ECh. 11 - Block that tip The driver of Exercise 3 wants to...Ch. 11 - Blocking tomatoes To obtain enough plants for the...Ch. 11 - Prob. 13ECh. 11 - Prob. 14ECh. 11 - Standardized test scores For his statistics class...Ch. 11 - Heart attacks and height Researchers who examined...Ch. 11 - Prob. 17ECh. 11 - Prob. 18ECh. 11 - Menopause Researchers studied the herb black...Ch. 11 - Honesty Coffee stations in offices often just ask...Ch. 11 - 2134. Whats the design? Read each brief report of...Ch. 11 - 2134. Whats the design? Read each brief report of...Ch. 11 - 2134. Whats the design? Read each brief report of...Ch. 11 - 2134. Whats the design? Read each brief report of...Ch. 11 - 2134. Whats the design? Read each brief report of...Ch. 11 - 2134. Whats the design? Read each brief report of...Ch. 11 - 2134. Whats the design? Read each brief report of...Ch. 11 - 2134. Whats the design? Read each brief report of...Ch. 11 - 2134. Whats the design? Read each brief report of...Ch. 11 - 2134. Whats the design? Read each brief report of...Ch. 11 - 2134. Whats the design? Read each brief report of...Ch. 11 - 2134. Whats the design? Read each brief report of...Ch. 11 - 2134. Whats the design? Read each brief report of...Ch. 11 - 2134. Whats the design? Read each brief report of...Ch. 11 - Omega-3 Exercise 21 describes an experiment that...Ch. 11 - Insomnia Exercise 24 describes an experiment...Ch. 11 - Omega-3, revisited Exercises 21 and 35 describe an...Ch. 11 - Insomnia, again Exercises 24 and 36 describe an...Ch. 11 - Omega-3, finis Exercises 21, 35, and 37 describe...Ch. 11 - Insomnia, at last Exercises 24, 36, and 38...Ch. 11 - Injuries Exercise 33 describes an experiment that...Ch. 11 - Tomatoes II Describe a strategy to randomly split...Ch. 11 - Shoes A running-shoe manufacturer wants to test...Ch. 11 - Swimsuits A swimsuit manufacturer wants to test...Ch. 11 - Hamstrings Exercise 33 discussed an experiment to...Ch. 11 - Diet and blood pressure An experiment showed that...Ch. 11 - Mozart Will listening to a Mozart piano sonata...Ch. 11 - Contrast baths Contrast bath treatments use the...Ch. 11 - Prob. 49ECh. 11 - Swimming Recently, a group of adults who swim...Ch. 11 - Dowsing Before drilling for water, many rural...Ch. 11 - Healing A medical researcher suspects that giving...Ch. 11 - Reading Some schools teach reading using phonics...Ch. 11 - Gas mileage Do cars get better gas mileage with...Ch. 11 - Weekend deaths A study published in the New...Ch. 11 - Shingles A research doctor has discovered a new...Ch. 11 - Beetles Hoping to learn how to control crop damage...Ch. 11 - SAT prep Can special study courses actually help...Ch. 11 - Safety switch An industrial machine requires an...Ch. 11 - Washing clothes A consumer group wants to test the...Ch. 11 - Skydiving, anyone? A humor piece published in the...
Knowledge Booster


Learn more about
Need a deep-dive on the concept behind this application? Look no further. Learn more about this topic, statistics and related others by exploring similar questions and additional content below.Similar questions
- Q.2.3 The probability that a randomly selected employee of Company Z is female is 0.75. The probability that an employee of the same company works in the Production department, given that the employee is female, is 0.25. What is the probability that a randomly selected employee of the company will be female and will work in the Production department? Q.2.4 There are twelve (12) teams participating in a pub quiz. What is the probability of correctly predicting the top three teams at the end of the competition, in the correct order? Give your final answer as a fraction in its simplest form.arrow_forwardQ.2.1 A bag contains 13 red and 9 green marbles. You are asked to select two (2) marbles from the bag. The first marble selected will not be placed back into the bag. Q.2.1.1 Construct a probability tree to indicate the various possible outcomes and their probabilities (as fractions). Q.2.1.2 What is the probability that the two selected marbles will be the same colour? Q.2.2 The following contingency table gives the results of a sample survey of South African male and female respondents with regard to their preferred brand of sports watch: PREFERRED BRAND OF SPORTS WATCH Samsung Apple Garmin TOTAL No. of Females 30 100 40 170 No. of Males 75 125 80 280 TOTAL 105 225 120 450 Q.2.2.1 What is the probability of randomly selecting a respondent from the sample who prefers Garmin? Q.2.2.2 What is the probability of randomly selecting a respondent from the sample who is not female? Q.2.2.3 What is the probability of randomly…arrow_forwardTest the claim that a student's pulse rate is different when taking a quiz than attending a regular class. The mean pulse rate difference is 2.7 with 10 students. Use a significance level of 0.005. Pulse rate difference(Quiz - Lecture) 2 -1 5 -8 1 20 15 -4 9 -12arrow_forward
- The following ordered data list shows the data speeds for cell phones used by a telephone company at an airport: A. Calculate the Measures of Central Tendency from the ungrouped data list. B. Group the data in an appropriate frequency table. C. Calculate the Measures of Central Tendency using the table in point B. D. Are there differences in the measurements obtained in A and C? Why (give at least one justified reason)? I leave the answers to A and B to resolve the remaining two. 0.8 1.4 1.8 1.9 3.2 3.6 4.5 4.5 4.6 6.2 6.5 7.7 7.9 9.9 10.2 10.3 10.9 11.1 11.1 11.6 11.8 12.0 13.1 13.5 13.7 14.1 14.2 14.7 15.0 15.1 15.5 15.8 16.0 17.5 18.2 20.2 21.1 21.5 22.2 22.4 23.1 24.5 25.7 28.5 34.6 38.5 43.0 55.6 71.3 77.8 A. Measures of Central Tendency We are to calculate: Mean, Median, Mode The data (already ordered) is: 0.8, 1.4, 1.8, 1.9, 3.2, 3.6, 4.5, 4.5, 4.6, 6.2, 6.5, 7.7, 7.9, 9.9, 10.2, 10.3, 10.9, 11.1, 11.1, 11.6, 11.8, 12.0, 13.1, 13.5, 13.7, 14.1, 14.2, 14.7, 15.0, 15.1, 15.5,…arrow_forwardPEER REPLY 1: Choose a classmate's Main Post. 1. Indicate a range of values for the independent variable (x) that is reasonable based on the data provided. 2. Explain what the predicted range of dependent values should be based on the range of independent values.arrow_forwardIn a company with 80 employees, 60 earn $10.00 per hour and 20 earn $13.00 per hour. Is this average hourly wage considered representative?arrow_forward
- The following is a list of questions answered correctly on an exam. Calculate the Measures of Central Tendency from the ungrouped data list. NUMBER OF QUESTIONS ANSWERED CORRECTLY ON AN APTITUDE EXAM 112 72 69 97 107 73 92 76 86 73 126 128 118 127 124 82 104 132 134 83 92 108 96 100 92 115 76 91 102 81 95 141 81 80 106 84 119 113 98 75 68 98 115 106 95 100 85 94 106 119arrow_forwardThe following ordered data list shows the data speeds for cell phones used by a telephone company at an airport: A. Calculate the Measures of Central Tendency using the table in point B. B. Are there differences in the measurements obtained in A and C? Why (give at least one justified reason)? 0.8 1.4 1.8 1.9 3.2 3.6 4.5 4.5 4.6 6.2 6.5 7.7 7.9 9.9 10.2 10.3 10.9 11.1 11.1 11.6 11.8 12.0 13.1 13.5 13.7 14.1 14.2 14.7 15.0 15.1 15.5 15.8 16.0 17.5 18.2 20.2 21.1 21.5 22.2 22.4 23.1 24.5 25.7 28.5 34.6 38.5 43.0 55.6 71.3 77.8arrow_forwardIn a company with 80 employees, 60 earn $10.00 per hour and 20 earn $13.00 per hour. a) Determine the average hourly wage. b) In part a), is the same answer obtained if the 60 employees have an average wage of $10.00 per hour? Prove your answer.arrow_forward
- The following ordered data list shows the data speeds for cell phones used by a telephone company at an airport: A. Calculate the Measures of Central Tendency from the ungrouped data list. B. Group the data in an appropriate frequency table. 0.8 1.4 1.8 1.9 3.2 3.6 4.5 4.5 4.6 6.2 6.5 7.7 7.9 9.9 10.2 10.3 10.9 11.1 11.1 11.6 11.8 12.0 13.1 13.5 13.7 14.1 14.2 14.7 15.0 15.1 15.5 15.8 16.0 17.5 18.2 20.2 21.1 21.5 22.2 22.4 23.1 24.5 25.7 28.5 34.6 38.5 43.0 55.6 71.3 77.8arrow_forwardBusinessarrow_forwardhttps://www.hawkeslearning.com/Statistics/dbs2/datasets.htmlarrow_forward
arrow_back_ios
SEE MORE QUESTIONS
arrow_forward_ios
Recommended textbooks for you
 Glencoe Algebra 1, Student Edition, 9780079039897...AlgebraISBN:9780079039897Author:CarterPublisher:McGraw Hill
 Big Ideas Math A Bridge To Success Algebra 1: Stu...AlgebraISBN:9781680331141Author:HOUGHTON MIFFLIN HARCOURTPublisher:Houghton Mifflin Harcourt
 Holt Mcdougal Larson Pre-algebra: Student Edition...AlgebraISBN:9780547587776Author:HOLT MCDOUGALPublisher:HOLT MCDOUGAL
 College Algebra (MindTap Course List)AlgebraISBN:9781305652231Author:R. David Gustafson, Jeff HughesPublisher:Cengage Learning
Glencoe Algebra 1, Student Edition, 9780079039897...
Algebra
ISBN:9780079039897
Author:Carter
Publisher:McGraw Hill
Big Ideas Math A Bridge To Success Algebra 1: Stu...
Algebra
ISBN:9781680331141
Author:HOUGHTON MIFFLIN HARCOURT
Publisher:Houghton Mifflin Harcourt
Holt Mcdougal Larson Pre-algebra: Student Edition...
Algebra
ISBN:9780547587776
Author:HOLT MCDOUGAL
Publisher:HOLT MCDOUGAL
College Algebra (MindTap Course List)
Algebra
ISBN:9781305652231
Author:R. David Gustafson, Jeff Hughes
Publisher:Cengage Learning
Hypothesis Testing using Confidence Interval Approach; Author: BUM2413 Applied Statistics UMP;https://www.youtube.com/watch?v=Hq1l3e9pLyY;License: Standard YouTube License, CC-BY
Hypothesis Testing - Difference of Two Means - Student's -Distribution & Normal Distribution; Author: The Organic Chemistry Tutor;https://www.youtube.com/watch?v=UcZwyzwWU7o;License: Standard Youtube License