
Videos
It is often useful for companies to know who their customers are and how they became customers. A credit card company is interested in whether the owner of the card applied for the card on his or her own or was contacted by a telemarketer. The company obtained the following sample information regarding end-of-the-month balances for the two groups.
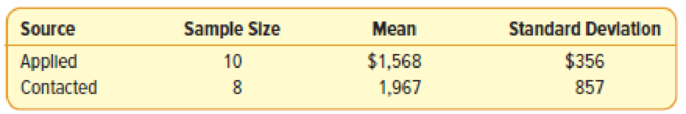
Is it reasonable to conclude the
- (a) State the null hypothesis and the alternate hypothesis.
- (b) How many degrees of freedom are there?
- (c) What is the decision rule?
- (d) What is the value of the test statistic?
- (e) What is your decision regarding the null hypothesis?
- (f) Interpret the result.
a.
State the null and the alternative hypothesis.
Answer to Problem 3SR
The null hypothesis is
The alternative hypothesis is
Explanation of Solution
In this context,
The hypotheses are given below:
In this context,
Null hypothesis:
Alternative hypothesis:
Thus, the null hypothesis is
b.
Find the number of degrees of freedom.
Answer to Problem 3SR
Thus, the number of degrees of freedom is 8.
Explanation of Solution
Calculation:
For t distribution with the two independent random samples, the degrees of freedom is as follows:
Substitute
Thus, the number of degrees of freedom is 8.
c.
Determine the decision rule.
Explanation of Solution
Step-by-step procedure to obtain the critical value using MINITAB software:
- Choose Graph > Probability Distribution Plot choose View Probability > OK.
- From Distribution, choose ‘t’ distribution.
- In Degrees of freedom, enter 8.
- Click the Shaded Area tab.
- Choose Probability and left Tail for the region of the curve to shade.
- Enter the Probability value as 0.05.
- Click OK.
Output obtained using MINITAB software is given below:
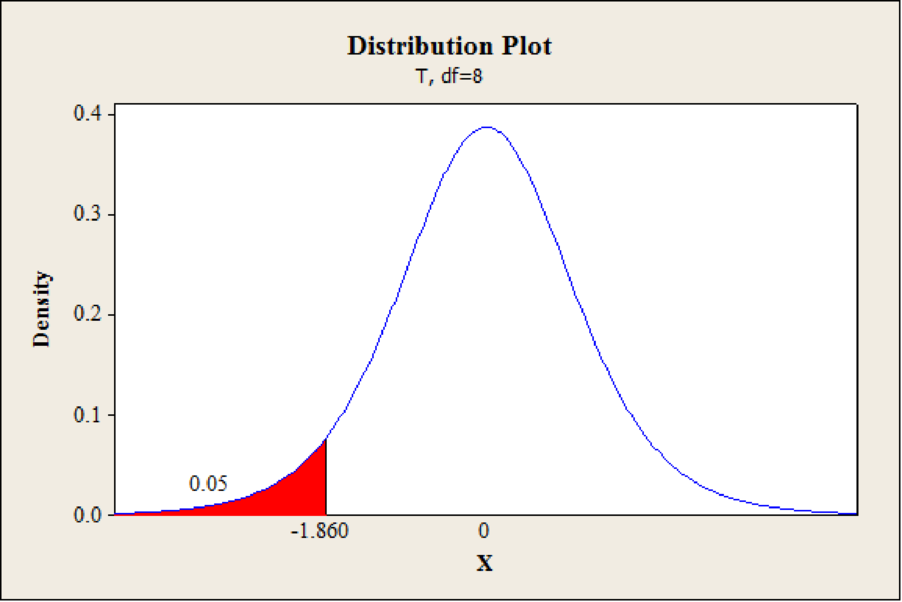
From the MINITAB output, the critical value is –1.860.
The decision rule is as follows:
If
d.
Find the value of test statistic.
Answer to Problem 3SR
Thus, the value of the test statistic is –1.234.
Explanation of Solution
Calculation:
Test statistic:
The test statistics is obtained as follows:
Thus, the test statistic is –1.234.
e.
Determine the decision regarding
Answer to Problem 3SR
The decision is that fail to reject the null hypothesis
Explanation of Solution
Decision:
The critical value is –1.860 and the value of test statistic is –1.234.
The value of test statistic is greater than the critical value.
That is,
From the decision rule, fail to reject the null hypothesis.
f.
Determine the interpretation of the study.
Answer to Problem 3SR
The interpretation is that there is no evidence that the mean balance is larger for the credit card holders contacted by telemarketers than those who applied on their won for the card.
Explanation of Solution
Interpretation:
From the decision rule, fail to reject the null hypothesis.
Therefore, there is no evidence that the mean balance is larger for the credit card holders contacted by telemarketers than those who applied on their won for the card.
Want to see more full solutions like this?
Chapter 11 Solutions
Loose Leaf for Statistical Techniques in Business and Economics (Mcgraw-hill/Irwin Series in Operations and Decision Sciences)


- Stem1: 1,4 Stem 2: 2,4,8 Stem3: 2,4 Stem4: 0,1,6,8 Stem5: 0,1,2,3,9 Stem 6: 2,2 What’s the Min,Q1, Med,Q3,Max?arrow_forwardAre the t-statistics here greater than 1.96? What do you conclude? colgPA= 1.39+0.412 hsGPA (.33) (0.094) Find the P valuearrow_forwardA poll before the elections showed that in a given sample 79% of people vote for candidate C. How many people should be interviewed so that the pollsters can be 99% sure that from 75% to 83% of the population will vote for candidate C? Round your answer to the whole number.arrow_forward
- Suppose a random sample of 459 married couples found that 307 had two or more personality preferences in common. In another random sample of 471 married couples, it was found that only 31 had no preferences in common. Let p1 be the population proportion of all married couples who have two or more personality preferences in common. Let p2 be the population proportion of all married couples who have no personality preferences in common. Find a95% confidence interval for . Round your answer to three decimal places.arrow_forwardA history teacher interviewed a random sample of 80 students about their preferences in learning activities outside of school and whether they are considering watching a historical movie at the cinema. 69 answered that they would like to go to the cinema. Let p represent the proportion of students who want to watch a historical movie. Determine the maximal margin of error. Use α = 0.05. Round your answer to three decimal places. arrow_forwardA random sample of medical files is used to estimate the proportion p of all people who have blood type B. If you have no preliminary estimate for p, how many medical files should you include in a random sample in order to be 99% sure that the point estimate will be within a distance of 0.07 from p? Round your answer to the next higher whole number.arrow_forward
- A clinical study is designed to assess the average length of hospital stay of patients who underwent surgery. A preliminary study of a random sample of 70 surgery patients’ records showed that the standard deviation of the lengths of stay of all surgery patients is 7.5 days. How large should a sample to estimate the desired mean to within 1 day at 95% confidence? Round your answer to the whole number.arrow_forwardA clinical study is designed to assess the average length of hospital stay of patients who underwent surgery. A preliminary study of a random sample of 70 surgery patients’ records showed that the standard deviation of the lengths of stay of all surgery patients is 7.5 days. How large should a sample to estimate the desired mean to within 1 day at 95% confidence? Round your answer to the whole number.arrow_forwardIn the experiment a sample of subjects is drawn of people who have an elbow surgery. Each of the people included in the sample was interviewed about their health status and measurements were taken before and after surgery. Are the measurements before and after the operation independent or dependent samples?arrow_forward
- iid 1. The CLT provides an approximate sampling distribution for the arithmetic average Ỹ of a random sample Y₁, . . ., Yn f(y). The parameters of the approximate sampling distribution depend on the mean and variance of the underlying random variables (i.e., the population mean and variance). The approximation can be written to emphasize this, using the expec- tation and variance of one of the random variables in the sample instead of the parameters μ, 02: YNEY, · (1 (EY,, varyi n For the following population distributions f, write the approximate distribution of the sample mean. (a) Exponential with rate ẞ: f(y) = ß exp{−ßy} 1 (b) Chi-square with degrees of freedom: f(y) = ( 4 ) 2 y = exp { — ½/ } г( (c) Poisson with rate λ: P(Y = y) = exp(-\} > y! y²arrow_forward2. Let Y₁,……., Y be a random sample with common mean μ and common variance σ². Use the CLT to write an expression approximating the CDF P(Ỹ ≤ x) in terms of µ, σ² and n, and the standard normal CDF Fz(·).arrow_forwardmatharrow_forward
 Glencoe Algebra 1, Student Edition, 9780079039897...AlgebraISBN:9780079039897Author:CarterPublisher:McGraw Hill
 Big Ideas Math A Bridge To Success Algebra 1: Stu...AlgebraISBN:9781680331141Author:HOUGHTON MIFFLIN HARCOURTPublisher:Houghton Mifflin Harcourt
 Holt Mcdougal Larson Pre-algebra: Student Edition...AlgebraISBN:9780547587776Author:HOLT MCDOUGALPublisher:HOLT MCDOUGAL
 College Algebra (MindTap Course List)AlgebraISBN:9781305652231Author:R. David Gustafson, Jeff HughesPublisher:Cengage Learning