
Videos
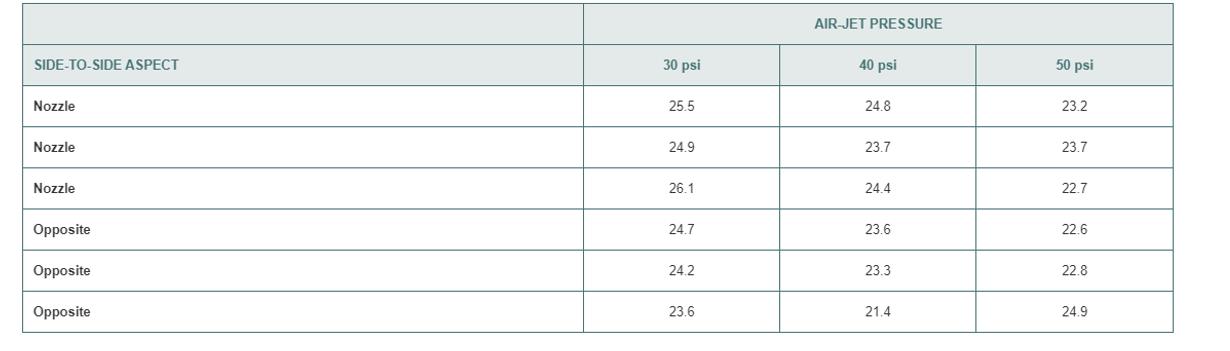
Suppose that, when setting up the experiment in Problem 11.38, the operations manager is able to study the effect of side-to-side aspect in addition to air-jet pressure. Thus, instead of the one-factor completely randomized design in Problem 11.38, a two-factor factorial design was used, with first factor, side-to-side aspect, having two levels (nozzle and opposite) and the second factor, air-jet pressure, having three levels (30 psi, 40 psi, and 50 psi). A sample of 18 yarns is randomly assigned, 3 to each of the 6-side-to-side aspect and pressure level combinations. The breaking-strength, stored in yarn, are as follows:
At the 0.05 level of significance.
a. is there an interaction between side-to-side aspect and air-jet pressure?
b. is there an effect due to side-to-side aspect?
c. is there an effect due to air-jet pressure?
d. Plot the
e. if appropriate, use the Turkey procedure to study difference among the air-jet pressures.
f. On the basis of the results of (a) through (e), what conclusions can you reach concerning yarn breaking strength? Discuss.
g. Compare your results in (a) through (f) with those from the completely randomized design in Problem 11.38. Discuss fully.
Want to see the full answer?
Check out a sample textbook solution
Chapter 11 Solutions
Basic Business Statistics


- 9. The concentration function of a random variable X is defined as Qx(h) = sup P(x ≤ X ≤x+h), h>0. Show that, if X and Y are independent random variables, then Qx+y (h) min{Qx(h). Qr (h)).arrow_forward10. Prove that, if (t)=1+0(12) as asf->> O is a characteristic function, then p = 1.arrow_forward9. The concentration function of a random variable X is defined as Qx(h) sup P(x ≤x≤x+h), h>0. (b) Is it true that Qx(ah) =aQx (h)?arrow_forward
- 3. Let X1, X2,..., X, be independent, Exp(1)-distributed random variables, and set V₁₁ = max Xk and W₁ = X₁+x+x+ Isk≤narrow_forward7. Consider the function (t)=(1+|t|)e, ER. (a) Prove that is a characteristic function. (b) Prove that the corresponding distribution is absolutely continuous. (c) Prove, departing from itself, that the distribution has finite mean and variance. (d) Prove, without computation, that the mean equals 0. (e) Compute the density.arrow_forward1. Show, by using characteristic, or moment generating functions, that if fx(x) = ½ex, -∞0 < x < ∞, then XY₁ - Y2, where Y₁ and Y2 are independent, exponentially distributed random variables.arrow_forward
- 1. Show, by using characteristic, or moment generating functions, that if 1 fx(x): x) = ½exarrow_forward1990) 02-02 50% mesob berceus +7 What's the probability of getting more than 1 head on 10 flips of a fair coin?arrow_forward9. The concentration function of a random variable X is defined as Qx(h) sup P(x≤x≤x+h), h>0. = x (a) Show that Qx+b(h) = Qx(h).arrow_forward
- Suppose that you buy a lottery ticket, and you have to pick six numbers from 1 through 50 (repetitions allowed). Which combination is more likely to win: 13, 48, 17, 22, 6, 39 or 1, 2, 3, 4, 5, 6? barrow_forward2 Make a histogram from this data set of test scores: 72, 79, 81, 80, 63, 62, 89, 99, 50, 78, 87, 97, 55, 69, 97, 87, 88, 99, 76, 78, 65, 77, 88, 90, and 81. Would a pie chart be appropriate for this data? ganizing Quantitative Data: Charts and Graphs 45arrow_forward10 Meteorologists use computer models to predict when and where a hurricane will hit shore. Suppose they predict that hurricane Stat has a 20 percent chance of hitting the East Coast. a. On what info are the meteorologists basing this prediction? b. Why is this prediction harder to make than your chance of getting a head on your next coin toss? U anoiaarrow_forward
 MATLAB: An Introduction with ApplicationsStatisticsISBN:9781119256830Author:Amos GilatPublisher:John Wiley & Sons Inc
 Probability and Statistics for Engineering and th...StatisticsISBN:9781305251809Author:Jay L. DevorePublisher:Cengage Learning
 Statistics for The Behavioral Sciences (MindTap C...StatisticsISBN:9781305504912Author:Frederick J Gravetter, Larry B. WallnauPublisher:Cengage Learning
 Elementary Statistics: Picturing the World (7th E...StatisticsISBN:9780134683416Author:Ron Larson, Betsy FarberPublisher:PEARSON
 The Basic Practice of StatisticsStatisticsISBN:9781319042578Author:David S. Moore, William I. Notz, Michael A. FlignerPublisher:W. H. Freeman
 Introduction to the Practice of StatisticsStatisticsISBN:9781319013387Author:David S. Moore, George P. McCabe, Bruce A. CraigPublisher:W. H. Freeman