Videos
a.
To determine: The Expected Return and Standard Deviation for each Security.
Introduction: Expected Return is a process of estimating the
a.
Answer to Problem 35QP
The Expected Return is 12.50%, Variance is 0.002125 and Standard Deviation for Asset 1 is 4.61%. The Expected Return is 12.50%, Variance is 0.002125 and Standard Deviation for Asset 2 is 4.61%. The Expected Return is 12.50%, Variance is 0.002125 and Standard Deviation for Asset 3 is 4.61%.
Explanation of Solution
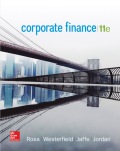
Determine the Expected Return, Variance and Standard Deviation for Asset 1
Using excel spreadsheet we calculate the expected return, variance and standard deviation as,
Excel Spreadsheet:
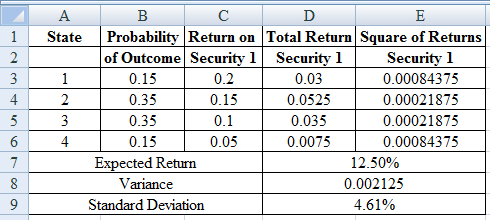
Excel Workings:
Therefore the Expected Return is 12.50%, Variance is 0.002125 and Standard Deviation for Asset 1 is 4.61%
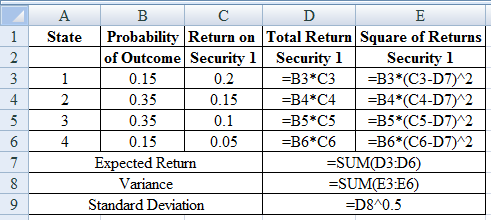
Determine the Expected Return, Variance and Standard Deviation for Asset 2
Using excel spreadsheet we calculate the expected return, variance and standard deviation as,
Excel Spreadsheet:
Excel Workings:
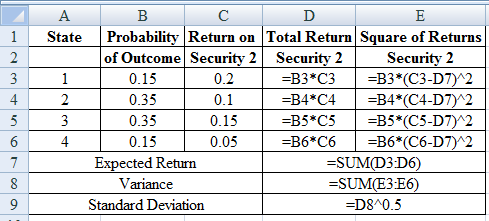
Therefore the Expected Return is 12.50%, Variance is 0.002125 and Standard Deviation for Asset 2 is 4.61%
Determine the Expected Return, Variance and Standard Deviation for Asset 3
Using excel spreadsheet we calculate the expected return, variance and standard deviation as,
Excel Spreadsheet:
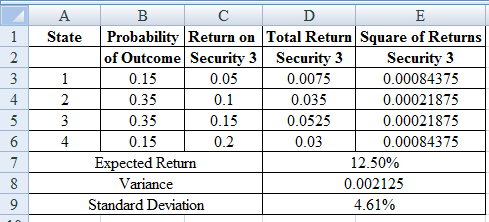
Excel Workings:
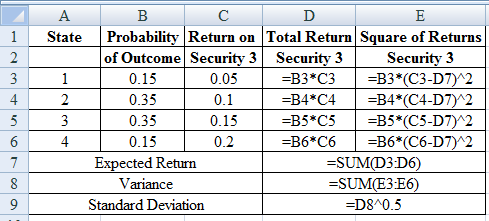
Therefore the Expected Return is 12.50%, Variance is 0.002125 and Standard Deviation for Asset 3 is 4.61%
b.
To determine: The Covariance and Correlation for each pair of security.
b.
Answer to Problem 35QP
Solution: The Covariance is 0.00125 and Correlation is 0.5882 for Security 1 and 2. The Covariance is -0.002125 and Correlation is -1 for Security 1 and 3. The Covariance is -0.00125 and Correlation is -0.5882 for Security 2 and 3.
Explanation of Solution
Determine the Covariance for Security 1 and 2
Using excel we find the covariance and correlation for security 1 and 2 as,
Excel Spreadsheet:
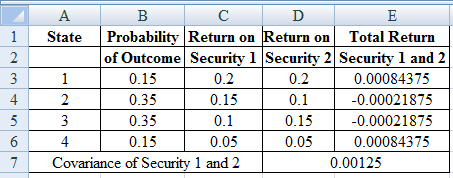
Excel Workings:
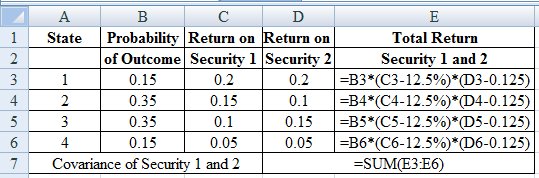
Therefore the Covariance for Security 1 and 2 is 0.00125
Determine the Correlation for Security 1 and 2
Therefore the Correlation for Security 1 and 2 is 0.5882
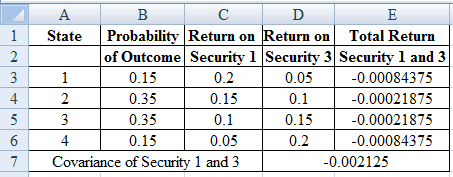
Determine the Covariance for Security 1 and 3
Using excel we find the covariance and correlation for security 1 and 3 as,
Excel Spreadsheet:
Excel Workings:
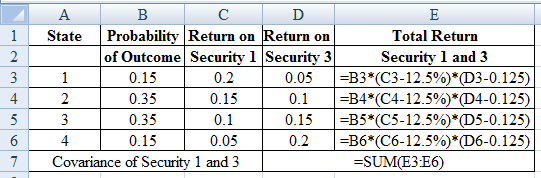
Therefore the Covariance for Security 1 and 3 is -0.00125
Determine the Correlation for Security 1 and 3
Therefore the Correlation for Security 1 and 3 is -1
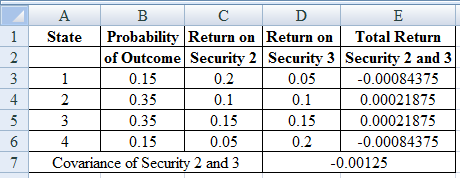
Determine the Covariance for Security 2 and 3
Using excel we find the covariance and correlation for security 2 and 3 as,
Excel Spreadsheet:
Excel Workings:
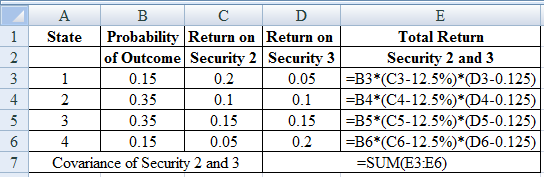
Therefore the Covariance for Security 2 and 3 is -0.00125
Determine the Correlation for Security 2 and 3
Therefore the Correlation for Security 2 and 3 is -0.5882.
c.
To determine: The Expected Return and Standard Deviation of Portfolio of Security 1 and Security 2.
c.
Answer to Problem 35QP
Solution: The Expected Return is 12.50% and Standard Deviation of Portfolio of Security 1 and Security 2 is 4.11%.
Explanation of Solution
Determine the Expected Return on Portfolio of Security 1 and 2
Therefore the Expected Return on Portfolio of Security 1 and 2 is 12.50%
Determine the Variance on Portfolio of Security 1 and 2
Therefore the Variance on Portfolio of Security 1 and 2 is 0.001687
Determine the Standard Deviation on Portfolio of Security 1 and 2
Therefore the Standard Deviation on Portfolio of Security 1 and 2 is 4.11%.
d.
To determine: The Expected Return and Standard Deviation of Portfolio of Security 1 and Security 3.
d.
Answer to Problem 35QP
The Expected Return is 12.50% and Standard Deviation of Portfolio of Security 1 and Security 3 is 0%.
Explanation of Solution
Determine the Expected Return on Portfolio of Security 1 and 3
Therefore the Expected Return on Portfolio of Security 1 and 3 is 12.50%
Determine the Variance on Portfolio of Security 1 and 3
Therefore the Variance on Portfolio of Security 1 and 3 is 0
Determine the Standard Deviation on Portfolio of Security 1 and 3
Therefore the Standard Deviation is 0%.
e.
To determine: The Expected Return and Standard Deviation of Portfolio of Security 2 and Security 3.
e.
Answer to Problem 35QP
The Expected Return is 12.50% and Standard Deviation of Portfolio of Security 2 and Security 3 is 2.09%.
Explanation of Solution
Determine the Expected Return on Portfolio of Security 2 and 3
Therefore the Expected Return on Portfolio of Security 2 and 3 is 12.50%
Determine the Variance on Portfolio of Security 2 and 3
Therefore the Variance on Portfolio of Security 2 and 3 is 0.000438
Determine the Standard Deviation on Portfolio of Security 2 and 3 is 0
Therefore the Standard Deviation is 2.09%.
f.
To determine: The Results of parts (a), (c), (d) and (e).
f.
Explanation of Solution
- The correlation between's the profits on two securities is below 1, there is an advantage to diversification.
- A portfolio that comprise of negatively correlated portfolios can accomplish higher risk diminishment than a positively correlated portfolio and the expected return of the stock being even.
- Applying appropriate weights on perfectly negatively correlated securities can lessen portfolio change to 0.
Want to see more full solutions like this?
Chapter 11 Solutions
EBK CORPORATE FINANCE


- Sales are $2.90 million, cost of goods sold is $590,000, depreciation expense is $148,000, other operating expenses are $298,000, addition to retained earnings is $1,126,625, dividends per share are $1, tax rate is 21 percent, and number of shares of common stock outstanding is 88,000. LaTonya's Flop Shops has no preferred stock outstanding. Use the above information to calculate the times interest earned ratio for LaTonya's Flop Shops, Incorporated. Note: Round your answer to 2 decimal places. Interest earned timesarrow_forwardTwo building owners - Alice and Bob - each own a building worth $1,000,000. They are considering forming a mutual insurance pool. Based on historical data, there are three possible fire damage scenarios for each building in a given year: No damage: 85% probability Partial damage: 12% probability, with repair costs of $200,000 Total loss: 3% probability, with a cost of $1,000,000 Calculate the standard deviationarrow_forwardWhat is the role of the researcher, population and sampling, and data collection, could you help explain each one of them? How to start working on the population structures essential to research? What are the structured ways in which to present key research elements?arrow_forward
- Could you please help explain the Qualitative Research Data Analysis? What is the Coding, and Interrater Reliability? How do they work and when we use them?What are the description of populations and Samples, please help to explain them.arrow_forwardDon't used hand raiting and don't used Ai solutionarrow_forwardAll computations must be done and shown manually. Kindly no spreadsheetcomputations. So that I am able to follow and understand clearly please.arrow_forward
- Don't used hand raiting and don't used Ai solutionarrow_forwardOne year ago, the Jenkins Family Fun Center deposited $3,700 into an investment account for the purpose of buying new equipment four years from today. Today, they are adding another $5,500 to this account. They plan on making a final deposit of $7,700 to the account next year. How much will be available when they are ready to buy the equipment, assuming they earn a rate of return of 9 percent?arrow_forwardIt is anticipated that Pinnaclewalk will next pay an annual dividend of $2.2 per share in one year. The firm's cost of equity is 19.2% and its anticipated growth rate is 3.1%. There are 420000 outstanding. Use the Gordon Growth Model to price Pinnaclewalk's shares. {Express your answer in dollars and cents} What is Pinnaclewalk's market capitalization? {Express your answer in millions of dollars rounded to two decimal places}arrow_forward
- Thumbtack's capital structure is shown in table below. If taxes are paid annually and Thumbtack's combined tax rate is 36 percent, determine the weighted average cost of capital Loans Bonds 12%/yr/semi $3,000,000 8%/yr/qtr $4,500,000 Common Stock $72/share price; $2,000,000 $8/shr/yr dividend; Retained Earnings (Answer should be in %) 1%/yr share price growth $1,500,000arrow_forwardYou have an investment worth $61,345 that is expected to make regular monthly payments of $1,590 for 20 months and a special payment of $X in 3 months. The expected return for the investment is 0.92 percent per month and the first regular payment will be made in 1 month. What is X? Note: X is a positive number.arrow_forwardA bond with a par value of $1,000 and a maturity of 8 years is selling for $925. If the annual coupon rate is 7%, what’s the yield on the bond? What would be the yield if the bond had semiannual payments?arrow_forward
 EBK CONTEMPORARY FINANCIAL MANAGEMENTFinanceISBN:9781337514835Author:MOYERPublisher:CENGAGE LEARNING - CONSIGNMENT