
Concept explainers
Videos
E. Calculator Problems
You probably own a calculator and, of course, you are eager to put it to work doing practical math calculations. In this text we include problem sets for calculator users. These problems are taken from real-life situations and, unlike most textbook problems, involve big numbers and lots of calculations. If you think that having an electronic brain-in-a-box means that you do not need to know basic arithmetic, you will be disappointed. The calculator helps you to work faster, but it will not tell you what to do or how to do it.
Detailed instructions on using a calculator with whole numbers appears on page 68.
Here are a few helpful hints for calculator users:
- 1. Always estimate your answer before doing a calculation.
- 2. Check your answer by comparing it with the estimate or by the other methods shown in this text. Be certain that your answer makes sense.
- 3. If you doubt the calculator (they do break down, you know), put a problem in it whose answer you know, preferably a problem like the one you are solving.
Manufacturing The following table lists the number of widget fasteners made by each of the five machines at the Ace Widget Co. during the last ten working days.
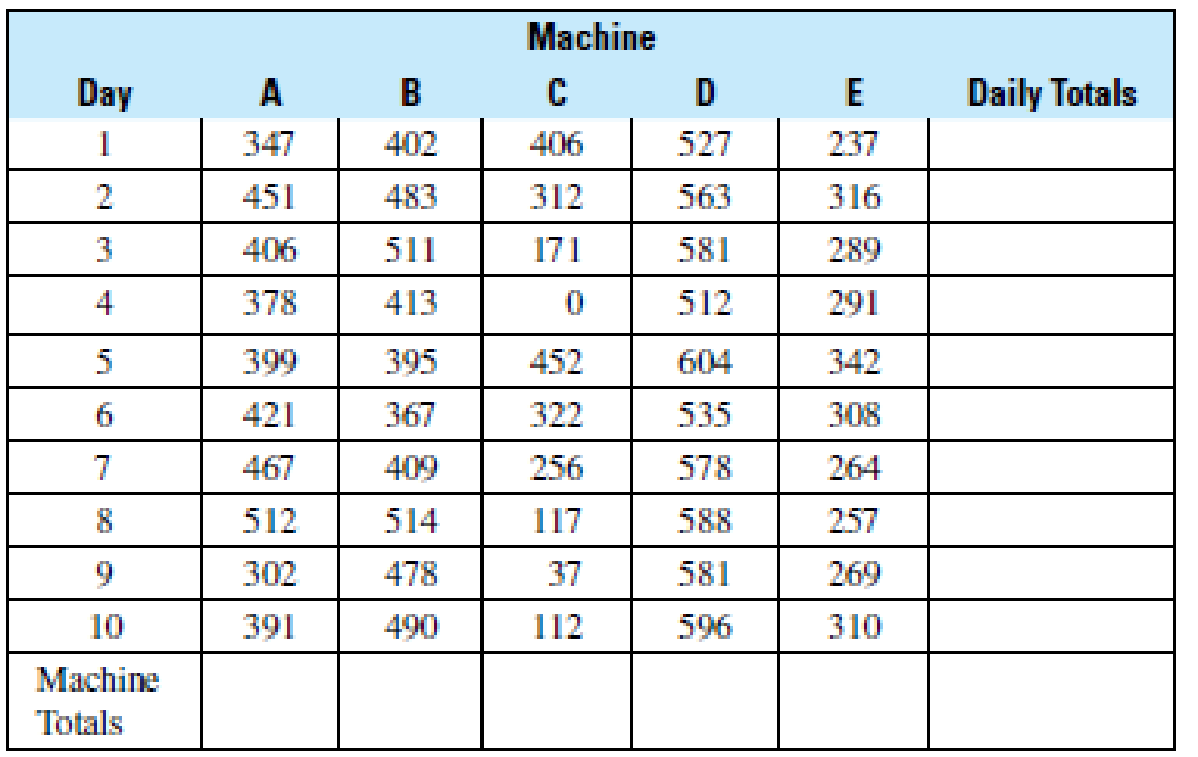
- (a) Complete the table by finding the number of fasteners produced each day. Enter these totals under the column “Daily Totals” on the right.
- (b) Find the number of fasteners produced by each machine during the ten-day period and enter these totals along the bottom row marked “Machine Totals.”
- (c) Does the sum of the daily totals equal the sum of the machine totals?
Want to see the full answer?
Check out a sample textbook solution
Chapter 1 Solutions
EBK MATHEMATICS FOR THE TRADES


- A marketing professor has surveyed the students at her university to better understand attitudes towards PPT usage for higher education. To be able to make inferences to the entire student body, the sample drawn needs to represent the university’s student population on all key characteristics. The table below shows the five key student demographic variables. The professor found the breakdown of the overall student body in the university’s fact book posted online. A non-parametric chi-square test was used to test the sample demographics against the population percentages shown in the table above. Review the output for the five chi-square tests on the following pages and answer the five questions: Based on the chi-square test, which sample variables adequately represent the university’s student population and which ones do not? Support your answer by providing the p-value of the chi-square test and explaining what it means. Using the results from Question 1, make recommendation for…arrow_forwardQuestion 10 6 5 4 3 2 -π/4 π/4 π/2 -1 -2 -3- -4 -5- -6+ For the graph above, find the function of the form f(x)=a tan(bx)+c where a=-1 or +1 only f(x) = Question Help: Videoarrow_forwardMODELING REAL LIFE Your checking account has a constant balance of $500. Let the function $m$ represent the balance of your savings account after $t$ years. The table shows the total balance of the accounts over time. Year, $t$ Total balance 0 1 2 3 4 5 $2500 $2540 $2580.80 $2622.42 $2664.86 $2708.16 a. Write a function $B$ that represents the total balance after $t$ years. Round values to the nearest hundredth, if necessary. $B\left(t\right)=$ Question 2 b. Find $B\left(8\right)$ . About $ a Question 3 Interpret $B\left(8\right)$ . b represents the total balance checking and saving accounts after 8 years the balance would be 16 / 10000 Word Limit16 words written of 10000 allowed Question 4 c. Compare the savings account to the account, You deposit $9000 in a savings account that earns 3.6% annual interest compounded monthly. A = 11998.70 SINCE 9000 is the principal ( 1+0.036/12)12 times 8 gives me aproxtimately 1997 14 / 10000 Word Limit14 words written of 10000 allowed Skip to…arrow_forward
- Listen MODELING REAL LIFE Your checking account has a constant balance of $500. Let the function m represent the balance of your savings account after t years. The table shows the total balance of the accounts over time. Year, t Total balance 0 $2500 1 $2540 2 $2580.80 3 $2622.42 4 $2664.86 5 $2708.16 a. Write a function B that represents the total balance after t years. Round values to the nearest hundredth, if necessary. B(t) = 500 + 2000(1.02)* b. Find B(8). About $2843.32 Interpret B(8). B I U E T² T₂ c. Compare the savings account to the account, You deposit $9000 in a savings account that earns 3.6% annual interest compounded monthly. B I U E E T² T₂ A = 11998.70 SINCE 9000 is the principal (1+0.036/12)12 times 8 gives me aproxtimately 1997arrow_forward14. Show that if a, b, and c are integers such that (a, b) = 1 and c | (a+b), then (c, a) = (c, b) = 1.arrow_forwardA retail chain is interested in determining whether a digital video point-of-purchase (POP) display would stimulate higher sales for a brand advertised compared to the standard cardboard point-of-purchase display. To test this, a one-shot static group design experiment was conducted over a four-week period in 100 different stores. Fifty stores were randomly assigned to the control treatment (standard display) and the other 50 stores were randomly assigned to the experimental treatment (digital display). Compare the sales of the control group (standard POP) to the experimental group (digital POP). What were the average sales for the standard POP display (control group)? What were the sales for the digital display (experimental group)? What is the (mean) difference in sales between the experimental group and control group? List the null hypothesis being tested. Do you reject or retain the null hypothesis based on the results of the independent t-test? Was the difference between the…arrow_forward
- Using fixed point iteration and Newton Raphson methods to solve the following function: f(x) = e−0.5x(4-x)-2. Take xo-2 and n=5.arrow_forwardUse the information to find and compare Δy and dy. (Round your answers to four decimal places.) y = x4 + 7 x = −3 Δx = dx = 0.01 Δy = dy =arrow_forwardWhat were the average sales for the four weeks prior to the experiment? What were the sales during the four weeks when the stores used the digital display? What is the mean difference in sales between the experimental and regular POP time periods? State the null hypothesis being tested by the paired sample t-test. Do you reject or retain the null hypothesis? At a 95% significance level, was the difference significant? Explain why or why not using the results from the paired sample t-test. Should the manager of the retail chain install new digital displays in each store? Justify your answer.arrow_forward
 Intermediate AlgebraAlgebraISBN:9781285195728Author:Jerome E. Kaufmann, Karen L. SchwittersPublisher:Cengage Learning
 Algebra for College StudentsAlgebraISBN:9781285195780Author:Jerome E. Kaufmann, Karen L. SchwittersPublisher:Cengage Learning