Concept explainers
Which data set is best illustrated with a bar graph? Explain why you feel that way, then draw a bar graph representing the data.
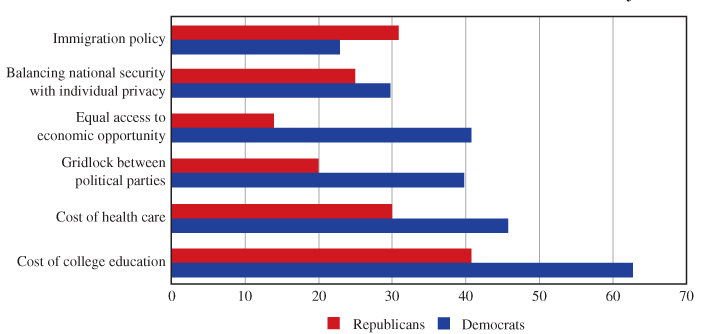
In May 2015, the Panetta Institute for Public Policy released the results of an extensive survey of college students. One of the questions was, “Do you think the following issues are or are not serious problems facing our country?” Results were divided by political party. Data for those self-reporting as either Democrat or Republican are illustrated by the following bar graph.
Which Issues Are Serious Problems for Our Countray?

Want to see the full answer?
Check out a sample textbook solution
Chapter 1 Solutions
PATHWAYS TO MATH LITERACY(LL)-W/ALEKS360
Additional Math Textbook Solutions
A First Course in Probability (10th Edition)
Pathways To Math Literacy (looseleaf)
College Algebra Essentials (5th Edition)
College Algebra (Collegiate Math)
Beginning and Intermediate Algebra
- 3. A different 7-Eleven has a bank of slurpee fountain heads. Their available flavors are as follows: Mountain Dew, Mountain Dew Code Red, Grape, Pepsi and Mountain Dew Livewire. You fill five different cups full with each type of flavor. How many different ways can you arrange the cups in a line if exactly two Mountain Dew flavors are next to each other? 3.2.1arrow_forwardBusinessarrow_forwardWhat is the area of this figure? 5 mm 4 mm 3 mm square millimeters 11 mm Submit 8 mm Work it out 9 mmarrow_forward
- No chatgpt pls will upvotearrow_forwardFind all solutions of the polynomial congruence x²+4x+1 = 0 (mod 143). (The solutions of the congruence x² + 4x+1=0 (mod 11) are x = 3,4 (mod 11) and the solutions of the congruence x² +4x+1 = 0 (mod 13) are x = 2,7 (mod 13).)arrow_forwardhttps://www.hawkeslearning.com/Statistics/dbs2/datasets.htmlarrow_forward
- Determine whether each function is an injection and determine whether each is a surjection.The notation Z_(n) refers to the set {0,1,2,...,n-1}. For example, Z_(4)={0,1,2,3}. f: Z_(6) -> Z_(6) defined by f(x)=x^(2)+4(mod6). g: Z_(5) -> Z_(5) defined by g(x)=x^(2)-11(mod5). h: Z*Z -> Z defined by h(x,y)=x+2y. j: R-{3} -> R defined by j(x)=(4x)/(x-3).arrow_forwardDetermine whether each function is an injection and determine whether each is a surjection.arrow_forwardLet A = {a, b, c, d}, B = {a,b,c}, and C = {s, t, u,v}. Draw an arrow diagram of a function for each of the following descriptions. If no such function exists, briefly explain why. (a) A function f : AC whose range is the set C. (b) A function g: BC whose range is the set C. (c) A function g: BC that is injective. (d) A function j : A → C that is not bijective.arrow_forward
 Glencoe Algebra 1, Student Edition, 9780079039897...AlgebraISBN:9780079039897Author:CarterPublisher:McGraw Hill
 Holt Mcdougal Larson Pre-algebra: Student Edition...AlgebraISBN:9780547587776Author:HOLT MCDOUGALPublisher:HOLT MCDOUGAL
 Big Ideas Math A Bridge To Success Algebra 1: Stu...AlgebraISBN:9781680331141Author:HOUGHTON MIFFLIN HARCOURTPublisher:Houghton Mifflin Harcourt


