
Concept explainers
Videos
Carefully read through the list of terminology we’ve used in this Unit. Consider circling the terms you aren’t familiar with and looking them up. Then test your understanding by using the list to fill in the appropriate blank in each sentence. Hint: One word is used twice.
axis
bar graph
categorical frequency distribution
classes
commutative
complement
compound interest
coordinates
data
degrees
element
empirical probability
exponential growth
grouped frequency distribution
histogram
interest
intersection
like quantities
linear growth
lower limit
origin
perimeter
pie chart
plotting points
population
probability
raw data
rectangular
representative sample
roster method
sample
scale
scientific notation
set
simple interest
stem and leaf plot
theoretical probability
time-series data
time-series graph
union
universal set
upper limit
Venn diagram
well-defined
x axis
y axis
A _______________ is a diagram used to compare the relative sizes of different parts of a whole.
To fill: The blank space in the provided statement, “A______ is a diagram used to compare the relative sizes of different parts of a whole”. By the use of provided list.
Answer to Problem 1LSR
Solution:
A pie chart is a diagram used to compare the relative sizes of different parts of a whole.
Explanation of Solution
Given information:
The provided list is below:
Explanation:
Consider the provided statement.
As it is known that the pie chart is a circle which is divided into a number of slices where each slice gives information about a particular data.
For example, the given pie chart representation of marks obtained by a student in different subjects- English, Hindi, Mathematics, Science and Social Science in an examination.
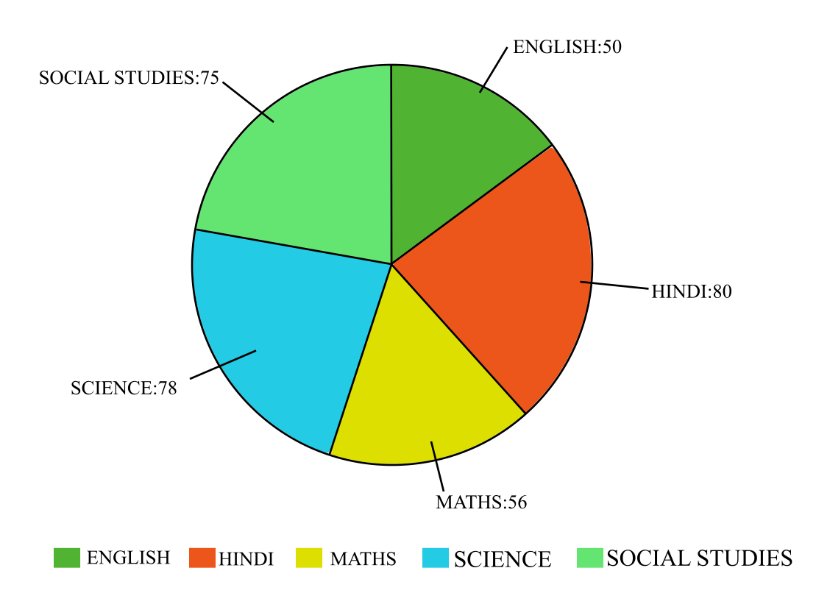
Therefore, the blank in the provided statement can be filled with the word pie chart.
Want to see more full solutions like this?
Chapter 1 Solutions
PATHWAYS TO MATH LITERACY(LL)-W/ALEKS360
Additional Math Textbook Solutions
College Algebra (Collegiate Math)
Intermediate Algebra (13th Edition)
Finite Mathematics for Business, Economics, Life Sciences and Social Sciences
Intro Stats, Books a la Carte Edition (5th Edition)
Precalculus: Mathematics for Calculus (Standalone Book)


- the set of all preimages of 2 isarrow_forwardWhich diagram(s) represent the following relationships An injective function from A to B? A surjective function from A to B? An injective function from B to A? A surjective function from B to A?arrow_forwardint/PlayerHomework.aspx?homeworkId=689099898&questionId=1&flushed=false&cid=8120746¢erw BP Physical Geograph... HW Score: 0%, 0 of 13 points ○ Points: 0 of 1 Determine if the values of the variables listed are solutions of the system of equations. 2x - y = 4 3x+5y= - 6 x=1, y = 2; (1,-2) Is (1, 2) a solution of the system of equations? L No Yes iew an example Get more help - Aarrow_forward
- Determine if each statement is true or false. If the statement is false, provide a brief explanation: a) There exists x = R such that √x2 = -x. b) Let A = {x = ZIx = 1 (mod 3)} and B = {x = ZIx is odd}. Then A and B are disjoint. c) Let A and B be subsets of a universal set U. If x = A and x/ € A - B,then x = An B.| E d) Let f : RR be defined by f (x) = 1 x + 2 1. Then f is surjective.arrow_forwardWrite the negation of the definition of an injective functionarrow_forwardLet U= {0, 1, 2, 3, 4, 5, 6, 7, 8, 9}, A = {xeU Ix is a multiple of 3}, and B = {x = UIx = 0 (mod 2)}. Use the roster method to list all elements in each of the following sets: a) A, b) B, c) A u B, d) B – A, e) A^cn Barrow_forward
- 12:01 PM Tue May 13 < AA ✓ Educatic S s3.amazona... A Assess Your... 目 accelerate-iu15-bssd.vschool.com S s3.amazona... Trigonometric Identities Module Exam Dashboard ... Dashboard ... Algebra 2 Pa... Algebra 2 Part 4 [Honors] (Acc. Ed.) (Zimmerman) 24-25 / Module 11: Trigonometric Identities i + 38% ✰ Start Page Alexis Forsythe All changes saved 10. A sound wave's amplitude can be modeled by the function y = −7 sin ((x-1) + 4). Within the interval 0 < x < 12, when does the function have an amplitude of 4? (Select all that apply.) 9.522 seconds 4.199 seconds 0.522 seconds 1.199 seconds Previous 10 of 20 Nextarrow_forwardTechniques QUAT6221 2025 PT B... TM Tabudi Maphoru Activities Assessments Class Progress lIE Library • Help v The table below shows the prices (R) and quantities (kg) of rice, meat and potatoes items bought during 2013 and 2014: 2013 2014 P1Qo PoQo Q1Po P1Q1 Price Ро Quantity Qo Price P1 Quantity Q1 Rice 7 80 6 70 480 560 490 420 Meat 30 50 35 60 1 750 1 500 1 800 2 100 Potatoes 3 100 3 100 300 300 300 300 TOTAL 40 230 44 230 2 530 2 360 2 590 2 820 Instructions: 1 Corall dawn to tha bottom of thir ceraan urina se se tha haca nariad in archerca antarand cubmit Q Search ENG US 口X 2025/05arrow_forwardThe table below indicates the number of years of experience of a sample of employees who work on a particular production line and the corresponding number of units of a good that each employee produced last month. Years of Experience (x) Number of Goods (y) 11 63 5 57 1 48 4 54 45 3 51 Q.1.1 By completing the table below and then applying the relevant formulae, determine the line of best fit for this bivariate data set. Do NOT change the units for the variables. X y X2 xy Ex= Ey= EX2 EXY= Q.1.2 Estimate the number of units of the good that would have been produced last month by an employee with 8 years of experience. Q.1.3 Using your calculator, determine the coefficient of correlation for the data set. Interpret your answer. Q.1.4 Compute the coefficient of determination for the data set. Interpret your answer.arrow_forward
 Holt Mcdougal Larson Pre-algebra: Student Edition...AlgebraISBN:9780547587776Author:HOLT MCDOUGALPublisher:HOLT MCDOUGAL
 Functions and Change: A Modeling Approach to Coll...AlgebraISBN:9781337111348Author:Bruce Crauder, Benny Evans, Alan NoellPublisher:Cengage Learning
 Glencoe Algebra 1, Student Edition, 9780079039897...AlgebraISBN:9780079039897Author:CarterPublisher:McGraw Hill
 Elementary AlgebraAlgebraISBN:9780998625713Author:Lynn Marecek, MaryAnne Anthony-SmithPublisher:OpenStax - Rice University
 Intermediate AlgebraAlgebraISBN:9781285195728Author:Jerome E. Kaufmann, Karen L. SchwittersPublisher:Cengage Learning