Videos
Answer the following questions using Figure 11.12:
- (a) What is the approximate equilibrium vapor pressure of water at 60 °C? Compare your answer with the data in Appendix G.
- (b) At what temperature does water have an equilibrium vapor pressure of 600 mm Hg?
- (c) Compare the equilibrium vapor pressures of water and ethanol at 70 °C. Which is higher?
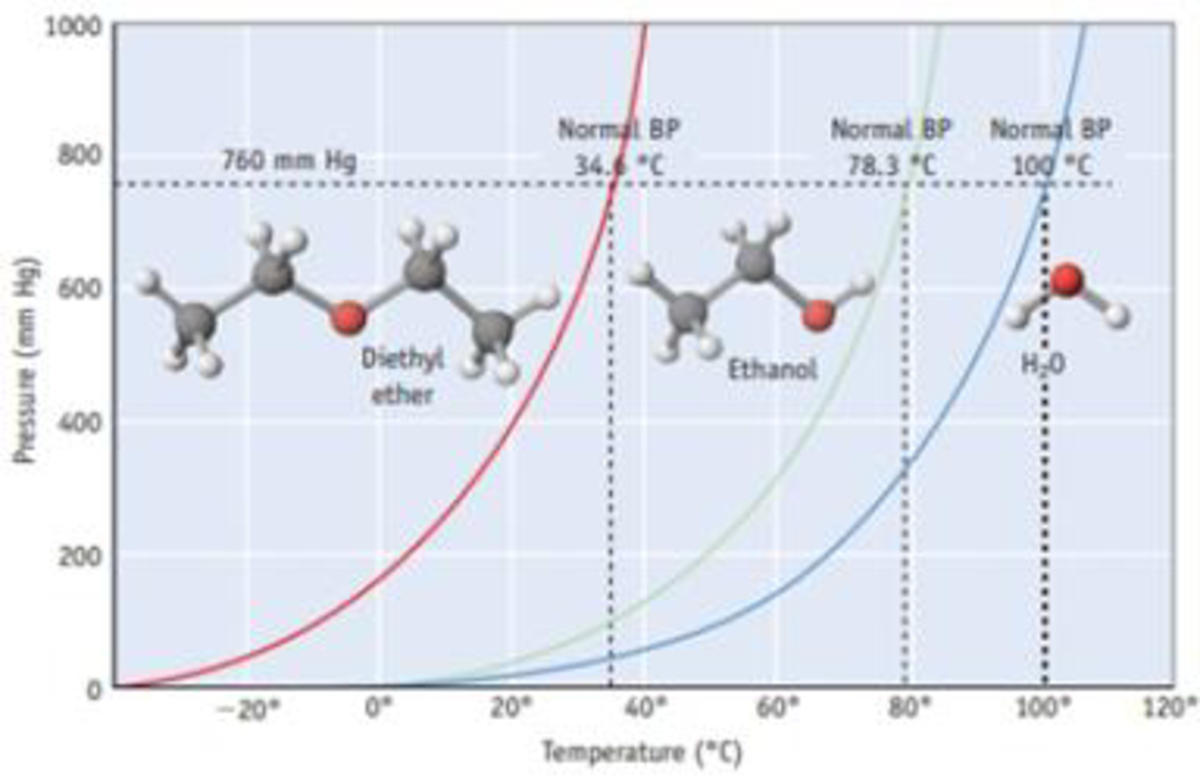
Figure 11.12 Vapor pressure curves for diethyl ether [(C2H3)2O], ethanol (C2H5OH), and water. Each curve represents conditions of T and P of which the two phases, liquid and vapor, are in equilibrium. These compounds exist as liquids for temperatures and pressures to the left of the curve and as gases under conditions to the right of the curve. (See Appendix G for vapor pressures for water of various temperatures.)

Trending nowThis is a popular solution!

Chapter 11 Solutions
Chemistry & Chemical Reactivity, Hybrid Edition (with OWLv2 24-Months Printed Access Card)
Additional Science Textbook Solutions
Chemistry: Structure and Properties (2nd Edition)
Laboratory Manual For Human Anatomy & Physiology
Physical Science
Physical Universe
The Cosmic Perspective (8th Edition)


- Calculate the variation in the potential of the Pt/MnO4-, Mn2+ pair with pH, indicating the value of the standard potential. Data: E0 = 1.12.arrow_forwardGiven the cell: Pt l H2(g) l dis X:KCl (sat) l Hg2Cl2(s) l Hg l Pt. Calculate the emf of the cell as a function of pH.arrow_forwardThe decimolar calomel electrode has a potential of 0.3335 V at 25°C compared to the standard hydrogen electrode. If the standard reduction potential of Hg22+ is 0.7973 V and the solubility product of Hg2Cl2 is 1.2x 10⁻¹⁸, find the activity of the chlorine ion at this electrode.Data: R = 8.314 J K-1 mol-1, F = 96485 C mol-1, T = 298.15 K.arrow_forward
- 2. Add the following group of numbers using the correct number of significant figures for the answer. Show work to earn full credit such as rounding off the answer to the correct number of significant figures. Replace the question marks with the calculated answers or write the calculated answers near the question marks. 10916.345 37.40832 5.4043 3.94 + 0.0426 ? (7 significant figures)arrow_forwardThe emf at 25°C of the cell: Pt l H2(g) l dis X:KCl (sat) l Hg2Cl2(s) l Hg l Pt was 612 mV. When solution X was replaced by normal phosphate buffer solution with a pH of 6.86, the emf was 741 mV. Calculate the pH of solution X.arrow_forwardIndicate how to calculate the potential E of the reaction Hg2Cl2(s) + 2e ⇄ 2Hg + 2Cl- as a function of the concentration of Cl- ions. Data: the solubility product of Hg2Cl2.arrow_forward
- How can Beer’s Law be used to determine the concentration in a selected food sample. Provide an in-depth discussion and examples of this.arrow_forwardb) H3C- H3C Me CH 3 I HN Me H+arrow_forwardUsing Luther's rule, determine the reference potentials of the electrodes corresponding to the low stability systems Co³+/Co and Cr²+/Cr from the data in the table. Electrodo ΕΝ Co²+/Co Co3+/Co²+ -0,28 +1,808 Cr³+ / Cr -0,508 Cr3+ / Cr²+ -0,41arrow_forward
- The molecule PYRIDINE, 6tt electrons and is there pore aromuntre and is Assigned the Following structure contenus Since aromatk moleculey undergo electrophilic allomatic substitution, Pyridine should undergo The Following reaction + HNO3 12504 a. write all of the possible Mononitration Products that could Result From this roaction Based upon the reaction the reaction mechanism determine which of these producty would be the major Product of the hegetionarrow_forwardUsing Benzene as starting materia Show how each of the Following molecules could Ve synthesked 9. CHI d. 10450 b 0 -50311 ८ City -5034 1-0-650 e NO2arrow_forwardBA HBr of the fol 1)=MgCI 2) H₂O major NaOEt Ts Cl Py (pyridine) 1) 03 2) Me2S 1arrow_forward
 Introductory Chemistry: A FoundationChemistryISBN:9781337399425Author:Steven S. Zumdahl, Donald J. DeCostePublisher:Cengage Learning
 Chemistry: Principles and ReactionsChemistryISBN:9781305079373Author:William L. Masterton, Cecile N. HurleyPublisher:Cengage Learning
 Chemistry: The Molecular ScienceChemistryISBN:9781285199047Author:John W. Moore, Conrad L. StanitskiPublisher:Cengage Learning
 ChemistryChemistryISBN:9781305957404Author:Steven S. Zumdahl, Susan A. Zumdahl, Donald J. DeCostePublisher:Cengage Learning
 Chemistry: An Atoms First ApproachChemistryISBN:9781305079243Author:Steven S. Zumdahl, Susan A. ZumdahlPublisher:Cengage Learning