
ORGANIC CHEMISTRY
5th Edition
ISBN: 9781259977596
Author: SMITH
Publisher: MCG
expand_more
expand_more
format_list_bulleted
Concept explainers
Videos
Textbook Question
Chapter 11, Problem 11.46P
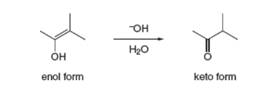
Tautomerization in base resembles tautomerization in acid, but deprotonation precedes protonation in the two-step mechanism. (a) Draw a stepwise mechanism for the following tautomeization. (b) Then draw a stepwise mechanism for the reverse reaction, the conversion of the keto form to the enol.
Expert Solution & Answer
Want to see the full answer?
Check out a sample textbook solution
Students have asked these similar questions
pressure (atm)
3
The pressure on a sample of pure X held at 47. °C and 0.88 atm is increased until the sample condenses. The pressure is then held constant and the
temperature is decreased by 82. °C. On the phase diagram below draw a path that shows this set of changes.
0
0
200
temperature (K)
400
а
er your payment details | bar xb Home | bartleby
x +
aleksogi/x/isl.exe/1o u-lgNskr7j8P3jH-1Qs_pBanHhviTCeeBZbufuBYT0Hz7m7D3ZcW81NC1d8Kzb4srFik1OUFhKMUXzhGpw7k1
O States of Matter
Sketching a described thermodynamic change on a phase diagram
0/5
The pressure on a sample of pure X held at 47. °C and 0.88 atm is increased until the sample condenses. The pressure is then held constant and the
temperature is decreased by 82. °C. On the phase diagram below draw a path that shows this set of changes.
pressure (atm)
1
3-
0-
0
200
Explanation
Check
temperature (K)
400
X
Q Search
L
G
2025 McGraw Hill LLC. All Rights Reserved Terms of Use Privacy Ce
5.
Chapter 11 Solutions
ORGANIC CHEMISTRY
Ch. 11 - Problem 11.1 Neopheliosyne B is a novel acetylenic...Ch. 11 - Give the IUPAC name for each compound.Ch. 11 - Give the structures corresponding to each of the...Ch. 11 - Prob. 11.4PCh. 11 - Prob. 11.5PCh. 11 - Which bases can deprotonate acetylene? The pKa...Ch. 11 - Draw the organic products formed when each alkyne...Ch. 11 - Draw additional resonance structures for each...Ch. 11 - Problem 11.9 Draw the products formed when is...Ch. 11 - Explain the following result. Although alkenes...
Ch. 11 - Problem 11.11 Draw the keto tautomer of each...Ch. 11 - Prob. 11.12PCh. 11 - a Draw two different enol tautomers of...Ch. 11 - Prob. 11.14PCh. 11 - Problem 11.15 Draw the organic products formed in...Ch. 11 - Problem 11.16 What acetylide anion and alkyl...Ch. 11 - Problem. 11.17 Show how , and can be used to...Ch. 11 - Prob. 11.18PCh. 11 - Draw the products of each reaction. a. b.Ch. 11 - Prob. 11.20PCh. 11 - Problem 11.21 Use retrosynthetic analysis to show...Ch. 11 - Prob. 11.22PCh. 11 - Give the IUPAC name for each compound. a. b.Ch. 11 - Prob. 11.24PCh. 11 - 11.25 Answer the following questions about...Ch. 11 - 11.26 Give the IUPAC name for each alkyne.
a. ...Ch. 11 - Prob. 11.27PCh. 11 - Which of the following pairs of compounds...Ch. 11 - Prob. 11.29PCh. 11 - 11.30 How is each compound related to A? Choose...Ch. 11 - Prob. 11.31PCh. 11 - Prob. 11.32PCh. 11 - 11.33 Draw the products formed when is treated...Ch. 11 - What reagents are needed to convert (CH3CH2)3CCCH...Ch. 11 - Prob. 11.35PCh. 11 - 11.36 What alkynes give each of the following...Ch. 11 - 11.37 What alkyne gives each compound as the only...Ch. 11 - 11.38 Draw the organic products formed in each...Ch. 11 - 11.39 Draw the structure of compounds A-E in the...Ch. 11 - Prob. 11.40PCh. 11 - Prob. 11.41PCh. 11 - 11.42 What reactions are needed to convert alcohol...Ch. 11 - Prob. 11.43PCh. 11 - Prob. 11.44PCh. 11 - 11.45 Explain the following statement. Although ...Ch. 11 - 11.46 Tautomerization in base resembles...Ch. 11 - 11.47 Draw a stepwise mechanism for each...Ch. 11 - Prob. 11.48PCh. 11 - Prob. 11.49PCh. 11 - 11.50 What acetylide anion and alkyl halide are...Ch. 11 - 11.51 Synthesize each compound from acetylene. You...Ch. 11 - 11.52 Devise a synthesis of each compound using ...Ch. 11 - Prob. 11.53PCh. 11 - Prob. 11.54PCh. 11 - 11.55 Devise a synthesis of the ketone, , from ...Ch. 11 - 11.56 Devise a synthesis of each compound using ...Ch. 11 - Prob. 11.57PCh. 11 - Prob. 11.58PCh. 11 - 11.59 N-Chlorosuccinimide (NCS) serves as a source...Ch. 11 - 11.60 Draw a stepwise mechanism for the following...Ch. 11 - 11.61 Draw a stepwise mechanism for the following...Ch. 11 - Prob. 11.62PCh. 11 - 11.63 Write a stepwise mechanism for each of the...Ch. 11 - Prob. 11.64PCh. 11 - 11.65 Explain why an optically active solution of ...
Additional Science Textbook Solutions
Find more solutions based on key concepts
Give the IUPAC name for each compound.
Organic Chemistry
45. Calculate the mass of nitrogen dissolved at room temperature in an 80.0-L home aquarium. Assume a total pre...
Chemistry: Structure and Properties (2nd Edition)
2. Which of the following is the best example of the use of a referent? _
a. A red bicycle
b. Big as a dump tru...
Physical Science
Whether two metal foil leaves an electroscope get opposite charge when the electroscope is charged.
Physics of Everyday Phenomena
Why is it unlikely that two neighboring water molecules would be arranged like this?
Campbell Biology (11th Edition)
2. Why is it that the range of resting blood pressures of humans is best represented by a bell-shaped curve co...
Human Biology: Concepts and Current Issues (8th Edition)
Knowledge Booster


Learn more about
Need a deep-dive on the concept behind this application? Look no further. Learn more about this topic, chemistry and related others by exploring similar questions and additional content below.Similar questions
- 6.arrow_forward0/5 alekscgi/x/sl.exe/1o_u-IgNglkr7j8P3jH-IQs_pBaHhvlTCeeBZbufuBYTi0Hz7m7D3ZcSLEFovsXaorzoFtUs | AbtAURtkqzol 1HRAS286, O States of Matter Sketching a described thermodynamic change on a phase diagram The pressure on a sample of pure X held at 47. °C and 0.88 atm is increased until the sample condenses. The pressure is then held constant and the temperature is decreased by 82. °C. On the phase diagram below draw a path that shows this set of changes. 3 pressure (atm) + 0- 0 5+ 200 temperature (K) 400 Explanation Check X 0+ F3 F4 F5 F6 F7 S 2025 McGraw Hill LLC All Rights Reserved. Terms of Use Privacy Center Accessibility Q Search LUCR + F8 F9 F10 F11 F12 * % & ( 5 6 7 8 9 Y'S Dele Insert PrtSc + Backsarrow_forward5.arrow_forward
- 9arrow_forwardalekscgi/x/lsl.exe/1o_u-IgNslkr7j8P3jH-IQs_pBanHhvlTCeeBZbufu BYTI0Hz7m7D3ZS18w-nDB10538ZsAtmorZoFusYj2Xu9b78gZo- O States of Matter Sketching a described thermodynamic change on a phase diagram 0/5 The pressure on a sample of pure X held at 47. °C and 0.88 atm is increased until the sample condenses. The pressure is then held constant and the temperature is decreased by 82. °C. On the phase diagram below draw a path that shows this set of changes. pressure (atm) 3- 200 temperature (K) Explanation Chick Q Sowncharrow_forward0+ aleksog/x/lsl.exe/1ou-lgNgkr7j8P3H-IQs pBaHhviTCeeBZbufuBYTOHz7m7D3ZStEPTBSB3u9bsp3Da pl19qomOXLhvWbH9wmXW5zm O States of Matter Sketching a described thermodynamic change on a phase diagram 0/5 Gab The temperature on a sample of pure X held at 0.75 atm and -229. °C is increased until the sample sublimes. The temperature is then held constant and the pressure is decreased by 0.50 atm. On the phase diagram below draw a path that shows this set of changes. F3 pressure (atm) 0- 0 200 Explanation temperature (K) Check F4 F5 ☀+ Q Search Chill Will an 9 ENG F6 F7 F8 F9 8 Delete F10 F11 F12 Insert PrtSc 114 d Ararrow_forward
- x + LEKS: Using a phase diagram a X n/alekscgi/x/lsl.exe/10_u-IgNsikr7j8P3jH-IQs_pBan HhvlTCeeBZbufu BYTI0Hz7m7D3ZcHYUt80XL-5alyVpw ○ States of Matter Using a phase diagram to find a phase transition temperature or pressure Use the phase diagram of Substance X below to find the melting point of X when the pressure above the solid is 1.1 atm. pressure (atm) 16 08- solid liquid- 0 200 400 gas 600 temperature (K) Note: your answer must be within 25 °C of the exact answer to be graded correct. × 5arrow_forwardS: Using a phase diagram leksogi/x/sl.exe/1ou-IgNs kr 7j8P3jH-IQs_pBan HhvTCeeBZbufuBYTI0Hz7m7D3ZdHYU+80XL-5alyVp O States of Matter Using a phase diagram to find a phase transition temperature or pressure se the phase diagram of Substance X below to find the boiling point of X when the pressure on the liquid is 1.6 atm. pressure (atm) 32- 16- solid liquid 0. gas 100 200 temperature (K) 300 Note: your answer must be within 12.5 °C of the exact answer to be graded correct. 10 Explanation Check § Q Search J 2025 McGraw Hill LLC. All Rights Researrow_forward151.2 254.8 85.9 199.6 241.4 87.6 242.5 186.4 155.8 257.1 242.9 253.3 256.0 216.6 108.7 239.0 149.7 236.4 152.1 222.7 148.7 278.2 268.7 234.4 262.7 283.2 143.6 QUESTION: Using this group of data on salt reduced tomato sauce concentration readings answer the following questions: 1. 95% Cl Confidence Interval (mmol/L) 2. [Na+] (mg/100 mL) 3. 95% Na+ Confidence Interval (mg/100 mL)arrow_forward
- Results Search Results Best Free Coursehero Unloc xb Success Confirmation of Q x O Google Pas alekscgi/x/lsl.exe/1o_u-IgNslkr 7j8P3jH-IQs_pBanHhvlTCeeBZbufu BYTI0Hz7m7D3ZcHYUt80XL-5alyVpwDXM TEZayFYCavJ17dZtpxbFD0Qggd1J O States of Matter Using a phase diagram to find a phase transition temperature or pressure Gabr 3/5 he pressure above a pure sample of solid Substance X at 101. °C is lowered. At what pressure will the sample sublime? Use the phase diagram of X below to nd your answer. pressure (atm) 24- 12 solid liquid gas 200 400 temperature (K) 600 ote: your answer must be within 0.15 atm of the exact answer to be graded correct. atm Thanation Check © 2025 McGraw Hill LLC. All Rights Reserved. Terms of Use | Privacy Center I Q Search L³ ملةarrow_forward301.7 348.9 193.7 308.6 339.5 160.6 337.7 464.7 223.5 370.5 326.6 327.5 336.1 317.9 203.8 329.8 221.9 331.7 211.7 309.6 223.4 353.7 334.6 305.6 340.0 304.3 244.7 QUESTION: Using this group of data on regular tomato sauce concentration readings answer the following questions: 1. 95% Cl Confidence Interval (mmol/L) 2. [Na+] (mg/100 mL) 3. 95% Na+ Confidence Interval (mg/100 mL)arrow_forwardSearch Results Search Results Best Free Coursehero Unlo x b Success Confirmation of Q aleks.com/alekscgi/x/sl.exe/10_u-lgNslkr7j8P3jH-IQs_pBan HhvlTCeeBZbufu BYTIOHz7m7D3ZcHYUt80XL-5alyVpwDXM TEZayFYCav States of Matter Using a phase diagram to find a phase transition temperature or pressure Use the phase diagram of Substance X below to find the temperature at which X turns to a gas, if the pressure above the solid is 3.7 atm. pressure (atm) 0. 32- 16 solid liquid gas 200 temperature (K) Note: your answer must be within 20 °C of the exact answer to be graded correct. Дос Xarrow_forward
arrow_back_ios
SEE MORE QUESTIONS
arrow_forward_ios
Recommended textbooks for you

Nomenclature: Crash Course Chemistry #44; Author: CrashCourse;https://www.youtube.com/watch?v=U7wavimfNFE;License: Standard YouTube License, CC-BY