
MICROECONOMICS IN MODULES
5th Edition
ISBN: 9781319245382
Author: KRUGMAN
Publisher: MAC HIGHER
expand_more
expand_more
format_list_bulleted
Question
Chapter 10A, Problem 1P
To determine
To draw:
A diagram containing, three of Isabella’s indifference curve for the following situations.
Concept Introductions:
Indifference curve: The indifference curve is a line showing all possible combinations of two goods which give the consumers equal satisfaction. In other words the consumer would be indifferent in these points.
Expert Solution & Answer
Explanation of Solution
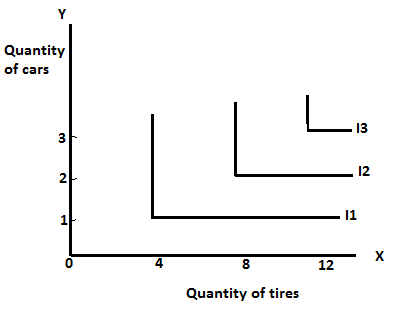
- If we Isabella want four tires for one car her indifference curve will look like the above given graph.
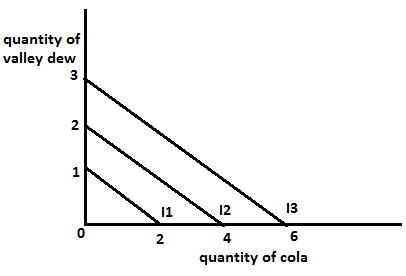
- In this situation the indifference curves for Isabella will be downward sloping as shown in the above graph
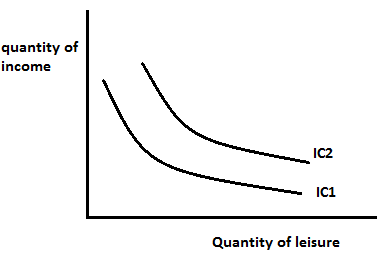
- In this situation the indifference curve for Isabella will be convex to the origin. This type of indifference curves is normal.
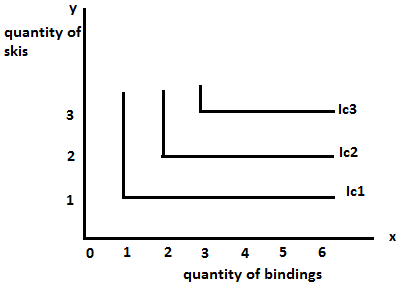
- The indifference curve for the bindings and skis for Isabella is shown in the above graph.
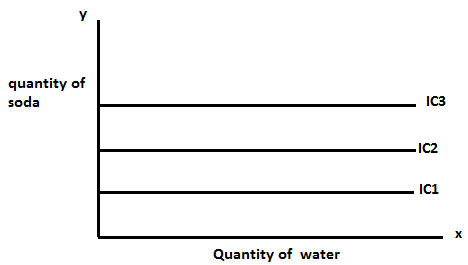
- Isabella’s indifference curve for water and soda are given above in the, in this case the indifference curve will be a vertical one.
Want to see more full solutions like this?
Subscribe now to access step-by-step solutions to millions of textbook problems written by subject matter experts!
Students have asked these similar questions
Government Purchases
and Tax Revenues
A
B
GDP
T₂
Refer to the diagram. Discretionary fiscal policy designed to slow the economy is illustrated by
Multiple Choice
the shift of curve T₁ to T2.
a movement from d to balong curve T₁.
Section III: Empirical Findings: Descriptive Statistics and inferential statistics………………..40%
Descriptive statistics provide details about the Y variable, based on the sample for the 10-year period. Here, you use Excell or manually compute
Mean or the average income per capita. Interpret the meaning of average income per capita.
Draw the line chart showing the educational performance over the time-period of your study. Label the Vertical axis as Y performance and X axis as the explanatory variable (X1) . Do the same thing between Y and X2
Empirical/ Inferential Statistics: Here, use the sample information to perform the following:
Draw the Scatter plot and impose the trend line: showing the Y variable and explanatory variables ( X1).
Draw the scatter plot and impose the tend line: Showing Y and X2.
Does your evidence (data) support your theory? Refer to the trend line: Is the relationship positive or negative as expected?
Based on the data sheet below:
Years
Y ( per…
Section III: Empirical Findings: Descriptive Statistics and inferential statistics………………..40%
Descriptive statistics provide details about the Y variable, based on the sample for the 10-year period. Here, you use Excell or manually compute
Mean or the average income per capita. Interpret the meaning of average income per capita.
Draw the line chart showing the educational performance over the time-period of your study. Label the Vertical axis as Y performance and X axis as the explanatory variable (X1) . Do the same thing between Y and X2
Empirical/ Inferential Statistics: Here, use the sample information to perform the following:
Draw the Scatter plot and impose the trend line: showing the Y variable and explanatory variables ( X1).
Draw the scatter plot and impose the tend line: Showing Y and X2.
Does your evidence (data) support your theory? Refer to the trend line: Is the relationship positive or negative as expected?
Create graphs based on table below;
Years
Y ( per…
Chapter 10A Solutions
MICROECONOMICS IN MODULES
Knowledge Booster

Similar questions
- Please help me with this Accounting questionarrow_forwardTitle: Does the educational performance depend on its literacy rate and government spending over the last 10 years? In the introduction, there are four things to include:a) Clearly state your research topic follows by country’s background in terms of (population density; male/female ratio; and identify the problem leading up to the study of it, such as government spending and adult literacy rate. How does the US perform compared to other countries.b) State the research question that you wish to resolve: Does the US economic performance depend on its government spending on education and the literacy rate over the last 10 years. Define performance (Y) as the average income per capita, an indicator of the country’s economy growing over time. For example, an increase in government spending leads to higher literacy rates and subsequently higher productivity in the economy. Also, mention that you will use a sample size of 10 years of secondary data from the existing literature,…arrow_forwardTitle: Does the educational performance depend on its literacy rate and government spending over the last 10 years? In the introduction, there are four things to include:a) Clearly state your research topic follows by country’s background in terms of (population density; male/female ratio; and identify the problem leading up to the study of it, such as government spending and adult literacy rate. How does the US perform compared to other countries.b) State the research question that you wish to resolve: Does the US economic performance depend on its government spending on education and the literacy rate over the last 10 years. Define performance (Y) as the average income per capita, an indicator of the country’s economy growing over time. For example, an increase in government spending leads to higher literacy rates and subsequently higher productivity in the economy. Also, mention that you will use a sample size of 10 years of secondary data from the existing literature,…arrow_forward
- Explain how the introduction of egg replacers and plant-based egg products will impact the bakery industry. Provide a graphical representation.arrow_forwardExplain Professor Frederick's "cognitive reflection" test.arrow_forward11:44 Fri Apr 4 Would+You+Take+the+Bird+in+the+Hand Would You Take the Bird in the Hand, or a 75% Chance at the Two in the Bush? BY VIRGINIA POSTREL WOULD you rather have $1,000 for sure or a 90 percent chance of $5,000? A guaranteed $1,000 or a 75 percent chance of $4,000? In economic theory, questions like these have no right or wrong answers. Even if a gamble is mathematically more valuable a 75 percent chance of $4,000 has an expected value of $3,000, for instance someone may still prefer a sure thing. People have different tastes for risk, just as they have different tastes for ice cream or paint colors. The same is true for waiting: Would you rather have $400 now or $100 every year for 10 years? How about $3,400 this month or $3,800 next month? Different people will answer differently. Economists generally accept those differences without further explanation, while decision researchers tend to focus on average behavior. In decision research, individual differences "are regarded…arrow_forward
- Describe the various measures used to assess poverty and economic inequality. Analyze the causes and consequences of poverty and inequality, and discuss potential policies and programs aimed at reducing them, assess the adequacy of current environmental regulations in addressing negative externalities. analyze the role of labor unions in labor markets. What is one benefit, and one challenge associated with labor unions.arrow_forwardEvaluate the effectiveness of supply and demand models in predicting labor market outcomes. Justify your assessment with specific examples from real-world labor markets.arrow_forwardExplain the difference between Microeconomics and Macroeconomics? 2.) Explain what fiscal policy is and then explain what Monetary Policy is? 3.) Why is opportunity cost and give one example from your own of opportunity cost. 4.) What are models and what model did we already discuss in class? 5.) What is meant by scarcity of resources?arrow_forward
- 2. What is the payoff from a long futures position where you are obligated to buy at the contract price? What is the payoff from a short futures position where you are obligated to sell at the contract price?? Draw the payoff diagram for each position. Payoff from Futures Contract F=$50.85 S1 Long $100 $95 $90 $85 $80 $75 $70 $65 $60 $55 $50.85 $50 $45 $40 $35 $30 $25 Shortarrow_forward3. Consider a call on the same underlier (Cisco). The strike is $50.85, which is the forward price. The owner of the call has the choice or option to buy at the strike. They get to see the market price S1 before they decide. We assume they are rational. What is the payoff from owning (also known as being long) the call? What is the payoff from selling (also known as being short) the call? Payoff from Call with Strike of k=$50.85 S1 Long $100 $95 $90 $85 $80 $75 $70 $65 $60 $55 $50.85 $50 $45 $40 $35 $30 $25 Shortarrow_forward4. Consider a put on the same underlier (Cisco). The strike is $50.85, which is the forward price. The owner of the call has the choice or option to buy at the strike. They get to see the market price S1 before they decide. We assume they are rational. What is the payoff from owning (also known as being long) the put? What is the payoff from selling (also known as being short) the put? Payoff from Put with Strike of k=$50.85 S1 Long $100 $95 $90 $85 $80 $75 $70 $65 $60 $55 $50.85 $50 $45 $40 $35 $30 $25 Shortarrow_forward
arrow_back_ios
SEE MORE QUESTIONS
arrow_forward_ios
Recommended textbooks for you

 Principles of Economics (12th Edition)EconomicsISBN:9780134078779Author:Karl E. Case, Ray C. Fair, Sharon E. OsterPublisher:PEARSON
 Engineering Economy (17th Edition)EconomicsISBN:9780134870069Author:William G. Sullivan, Elin M. Wicks, C. Patrick KoellingPublisher:PEARSON
 Principles of Economics (MindTap Course List)EconomicsISBN:9781305585126Author:N. Gregory MankiwPublisher:Cengage Learning
 Managerial Economics: A Problem Solving ApproachEconomicsISBN:9781337106665Author:Luke M. Froeb, Brian T. McCann, Michael R. Ward, Mike ShorPublisher:Cengage Learning
 Managerial Economics & Business Strategy (Mcgraw-...EconomicsISBN:9781259290619Author:Michael Baye, Jeff PrincePublisher:McGraw-Hill Education
Principles of Economics (12th Edition)
Economics
ISBN:9780134078779
Author:Karl E. Case, Ray C. Fair, Sharon E. Oster
Publisher:PEARSON
Engineering Economy (17th Edition)
Economics
ISBN:9780134870069
Author:William G. Sullivan, Elin M. Wicks, C. Patrick Koelling
Publisher:PEARSON
Principles of Economics (MindTap Course List)
Economics
ISBN:9781305585126
Author:N. Gregory Mankiw
Publisher:Cengage Learning
Managerial Economics: A Problem Solving Approach
Economics
ISBN:9781337106665
Author:Luke M. Froeb, Brian T. McCann, Michael R. Ward, Mike Shor
Publisher:Cengage Learning
Managerial Economics & Business Strategy (Mcgraw-...
Economics
ISBN:9781259290619
Author:Michael Baye, Jeff Prince
Publisher:McGraw-Hill Education