
Bundle: Modern Business Statistics with Microsoft Office Excel, Loose-Leaf Version, 6th + MindTap Business Statistics, 2 terms (12 months) Printed Access Card
6th Edition
ISBN: 9781337589383
Author: David R. Anderson, Dennis J. Sweeney, Thomas A. Williams, Jeffrey D. Camm, James J. Cochran
Publisher: Cengage Learning
expand_more
expand_more
format_list_bulleted
Videos
Textbook Question
Chapter 10.4, Problem 35E
In a test of the quality of two television commercials, each commercial was shown in a separate test area six times over a one-week period. The following week a telephone survey was conducted to identify individuals who had seen the commercials. Those individuals were asked to state the primary message in the commercials. The following results were recorded.
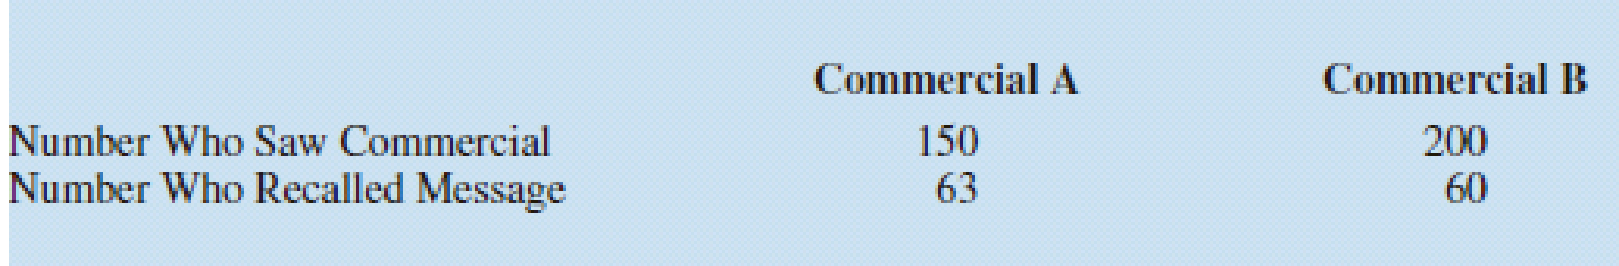
- a. Use α = .05 and test the hypothesis that there is no difference in the recall proportions for the two commercials.
- b. Compute a 95% confidence interval for the difference between the recall proportions for the two populations.
Expert Solution & Answer
Want to see the full answer?
Check out a sample textbook solution
Students have asked these similar questions
A 24-1 design has been used to investigate the effect of four factors on the resistivity of a silicon wafer. The data
from this experiment are shown in Table 4.
Table 4: Resistivity Experiment for Exercise 5
Run
A
B
с
D
Resistivity
1
23
2
3
4
5
6
7
8
9
10
11
12
I+I+I+I+Oooo
0
0
||++TI++o000
33.2
4.6
31.2
9.6
40.6
162.4
39.4
158.6
63.4
62.6
58.7
0
0
60.9
3
(a) Estimate the factor effects. Plot the effect estimates on a normal probability scale.
(b) Identify a tentative model for this process. Fit the model and test for curvature.
(c) Plot the residuals from the model in part (b) versus the predicted resistivity. Is there any indication on
this plot of model inadequacy?
(d) Construct a normal probability plot of the residuals. Is there any reason to doubt the validity of the
normality assumption?
Stem1: 1,4
Stem 2: 2,4,8
Stem3: 2,4
Stem4: 0,1,6,8
Stem5: 0,1,2,3,9
Stem 6: 2,2
What’s the Min,Q1, Med,Q3,Max?
Are the t-statistics here greater than 1.96? What do you conclude?
colgPA= 1.39+0.412 hsGPA
(.33) (0.094)
Find the P value
Chapter 10 Solutions
Bundle: Modern Business Statistics with Microsoft Office Excel, Loose-Leaf Version, 6th + MindTap Business Statistics, 2 terms (12 months) Printed Access Card
Ch. 10.1 - The following results come from two independent...Ch. 10.1 - 2. Consider the following hypothesis test.
The...Ch. 10.1 - 3. Consider the following hypothesis test.
The...Ch. 10.1 - 4. Condé Nast Traveler conducts an annual survey...Ch. 10.1 - 5. The USA Today reports that the average...Ch. 10.1 - Hotel Price Comparison. Suppose that you are...Ch. 10.1 - Consumer Reports uses a survey of readers to...Ch. 10.1 - Increases in Customer Satisfaction. Will improving...Ch. 10.2 - The following results are for independent random...Ch. 10.2 - Consider the following hypothesis test:
The...
Ch. 10.2 - Consider the following data for two independent...Ch. 10.2 - Prob. 12ECh. 10.2 - Annual Cost of College. The increasing annual cost...Ch. 10.2 - Are nursing salaries in Tampa, Florida, lower than...Ch. 10.2 - Hotel prices worldwide are projected to increase...Ch. 10.2 - Effect of Parents’ Education on Student SAT...Ch. 10.2 - Comparing Financial Consultant Ratings....Ch. 10.2 - Researchers at Purdue University and Wichita State...Ch. 10.3 - Consider the following hypothesis test.
The...Ch. 10.3 - The following data are from matched samples taken...Ch. 10.3 - Prob. 21ECh. 10.3 - The price per share of stock for a sample of 25...Ch. 10.3 - Credit Card Expenditures. Bank of America’s...Ch. 10.3 - Domestic Airfare. The Global Business Travel...Ch. 10.3 - Prob. 25ECh. 10.3 - PGA Tour Scores. Scores in the first and fourth...Ch. 10.3 - Price Comparison of Smoothie Blenders. A personal...Ch. 10.4 - Consider the following results for independent...Ch. 10.4 - Prob. 29ECh. 10.4 - Corporate Hiring Outlook. A Businessweek/Harris...Ch. 10.4 - Impact of Pinterest on Purchase Decisions. Forbes...Ch. 10.4 - Mislabeled Fish. Researchers with Oceana, a group...Ch. 10.4 - Minnesota had the highest turnout rate of any...Ch. 10.4 - Oil wells are expensive to drill, and dry wells...Ch. 10.4 - In a test of the quality of two television...Ch. 10.4 - Winter visitors are extremely important to the...Ch. 10.4 - Prob. 37ECh. 10 - Prob. 38SECh. 10 - SUV Lease Payments. Statista reports that the...Ch. 10 - Prob. 40SECh. 10 - Kitchen Versus Bedroom Remodeling Costs. The...Ch. 10 - Effect of Siblings on SAT Scores. In Born...Ch. 10 - Country Financial, a financial services company,...Ch. 10 - Prob. 44SECh. 10 - Prob. 45SECh. 10 - News Access Via Computer. The American Press...Ch. 10 - For the week ended January 15, 2009, the bullish...
Knowledge Booster


Learn more about
Need a deep-dive on the concept behind this application? Look no further. Learn more about this topic, statistics and related others by exploring similar questions and additional content below.Similar questions
- A poll before the elections showed that in a given sample 79% of people vote for candidate C. How many people should be interviewed so that the pollsters can be 99% sure that from 75% to 83% of the population will vote for candidate C? Round your answer to the whole number.arrow_forwardSuppose a random sample of 459 married couples found that 307 had two or more personality preferences in common. In another random sample of 471 married couples, it was found that only 31 had no preferences in common. Let p1 be the population proportion of all married couples who have two or more personality preferences in common. Let p2 be the population proportion of all married couples who have no personality preferences in common. Find a95% confidence interval for . Round your answer to three decimal places.arrow_forwardA history teacher interviewed a random sample of 80 students about their preferences in learning activities outside of school and whether they are considering watching a historical movie at the cinema. 69 answered that they would like to go to the cinema. Let p represent the proportion of students who want to watch a historical movie. Determine the maximal margin of error. Use α = 0.05. Round your answer to three decimal places. arrow_forward
- A random sample of medical files is used to estimate the proportion p of all people who have blood type B. If you have no preliminary estimate for p, how many medical files should you include in a random sample in order to be 99% sure that the point estimate will be within a distance of 0.07 from p? Round your answer to the next higher whole number.arrow_forwardA clinical study is designed to assess the average length of hospital stay of patients who underwent surgery. A preliminary study of a random sample of 70 surgery patients’ records showed that the standard deviation of the lengths of stay of all surgery patients is 7.5 days. How large should a sample to estimate the desired mean to within 1 day at 95% confidence? Round your answer to the whole number.arrow_forwardA clinical study is designed to assess the average length of hospital stay of patients who underwent surgery. A preliminary study of a random sample of 70 surgery patients’ records showed that the standard deviation of the lengths of stay of all surgery patients is 7.5 days. How large should a sample to estimate the desired mean to within 1 day at 95% confidence? Round your answer to the whole number.arrow_forward
- In the experiment a sample of subjects is drawn of people who have an elbow surgery. Each of the people included in the sample was interviewed about their health status and measurements were taken before and after surgery. Are the measurements before and after the operation independent or dependent samples?arrow_forwardiid 1. The CLT provides an approximate sampling distribution for the arithmetic average Ỹ of a random sample Y₁, . . ., Yn f(y). The parameters of the approximate sampling distribution depend on the mean and variance of the underlying random variables (i.e., the population mean and variance). The approximation can be written to emphasize this, using the expec- tation and variance of one of the random variables in the sample instead of the parameters μ, 02: YNEY, · (1 (EY,, varyi n For the following population distributions f, write the approximate distribution of the sample mean. (a) Exponential with rate ẞ: f(y) = ß exp{−ßy} 1 (b) Chi-square with degrees of freedom: f(y) = ( 4 ) 2 y = exp { — ½/ } г( (c) Poisson with rate λ: P(Y = y) = exp(-\} > y! y²arrow_forward2. Let Y₁,……., Y be a random sample with common mean μ and common variance σ². Use the CLT to write an expression approximating the CDF P(Ỹ ≤ x) in terms of µ, σ² and n, and the standard normal CDF Fz(·).arrow_forward
- matharrow_forwardCompute the median of the following data. 32, 41, 36, 42, 29, 30, 40, 22, 25, 37arrow_forwardTask Description: Read the following case study and answer the questions that follow. Ella is a 9-year-old third-grade student in an inclusive classroom. She has been diagnosed with Emotional and Behavioural Disorder (EBD). She has been struggling academically and socially due to challenges related to self-regulation, impulsivity, and emotional outbursts. Ella's behaviour includes frequent tantrums, defiance toward authority figures, and difficulty forming positive relationships with peers. Despite her challenges, Ella shows an interest in art and creative activities and demonstrates strong verbal skills when calm. Describe 2 strategies that could be implemented that could help Ella regulate her emotions in class (4 marks) Explain 2 strategies that could improve Ella’s social skills (4 marks) Identify 2 accommodations that could be implemented to support Ella academic progress and provide a rationale for your recommendation.(6 marks) Provide a detailed explanation of 2 ways…arrow_forward
arrow_back_ios
SEE MORE QUESTIONS
arrow_forward_ios
Recommended textbooks for you
 Glencoe Algebra 1, Student Edition, 9780079039897...AlgebraISBN:9780079039897Author:CarterPublisher:McGraw Hill
 College Algebra (MindTap Course List)AlgebraISBN:9781305652231Author:R. David Gustafson, Jeff HughesPublisher:Cengage Learning
 Holt Mcdougal Larson Pre-algebra: Student Edition...AlgebraISBN:9780547587776Author:HOLT MCDOUGALPublisher:HOLT MCDOUGAL
Glencoe Algebra 1, Student Edition, 9780079039897...
Algebra
ISBN:9780079039897
Author:Carter
Publisher:McGraw Hill
College Algebra (MindTap Course List)
Algebra
ISBN:9781305652231
Author:R. David Gustafson, Jeff Hughes
Publisher:Cengage Learning
Holt Mcdougal Larson Pre-algebra: Student Edition...
Algebra
ISBN:9780547587776
Author:HOLT MCDOUGAL
Publisher:HOLT MCDOUGAL
Hypothesis Testing using Confidence Interval Approach; Author: BUM2413 Applied Statistics UMP;https://www.youtube.com/watch?v=Hq1l3e9pLyY;License: Standard YouTube License, CC-BY
Hypothesis Testing - Difference of Two Means - Student's -Distribution & Normal Distribution; Author: The Organic Chemistry Tutor;https://www.youtube.com/watch?v=UcZwyzwWU7o;License: Standard Youtube License