
A Problem Solving Approach To Mathematics For Elementary School Teachers (13th Edition)
13th Edition
ISBN: 9780135183885
Author: Rick Billstein, Shlomo Libeskind, Johnny Lott, Barbara Boschmans
Publisher: PEARSON
expand_more
expand_more
format_list_bulleted
Concept explainers
Videos
Textbook Question
Chapter 10.3A, Problem 10A
Assessment
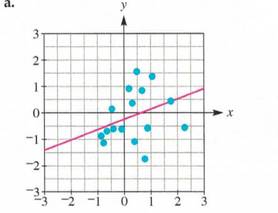
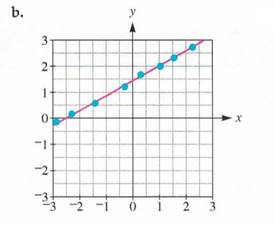
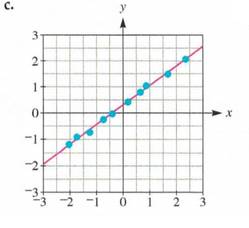
In the following scatterplots, find an equation of the trend line pictured.
Expert Solution & Answer
Want to see the full answer?
Check out a sample textbook solution
Students have asked these similar questions
Find the bisector of the angle <ABC in the Poincaré plane, where A=(0,5), B=(0,3) and C=(2,\sqrt{21})
The masses measured on a population of 100 animals were grouped in the
following table, after being recorded to the nearest gram
Mass
89 90-109 110-129 130-149 150-169 170-189 > 190
Frequency 3
7 34
43
10
2
1
You are given that the sample mean of the data is 131.5 and the sample
standard deviation is 20.0. Test the hypothesis that the distribution of masses
follows a normal distribution at the 5% significance level.
Let l=2L\sqrt{5} and P=(1,2) in the Poincaré plane. Find the uniqe line l' through P such that l' is orthogonal to l
Chapter 10 Solutions
A Problem Solving Approach To Mathematics For Elementary School Teachers (13th Edition)
Ch. 10.1 - Suggest how students at different grades might...Ch. 10.1 - Mathematical Connections What are the Nielsen...Ch. 10.1 - Prob. 4MCCh. 10.1 - Read about basic ideas of statistics in Common...Ch. 10.1 - National Assessment of Educational ProgressNAEP...Ch. 10.1 - Prob. 2NAEPCh. 10.1 - Prob. 3NAEPCh. 10.1A - If one wanted to study the effect of using a...Ch. 10.1A - Prob. 2ACh. 10.1A - Prob. 3A
Ch. 10.1A - Prob. 4ACh. 10.1A - Prob. 5ACh. 10.1A - Prob. 6ACh. 10.1A - A second-grade class has a project to determine...Ch. 10.1A - Prob. 8ACh. 10.1A - Prob. 9ACh. 10.1A - Decide whether each of the following questions is...Ch. 10.1A - Prob. 11ACh. 10.1A - If a class were to investigate how many countries...Ch. 10.1A - Prob. 13ACh. 10.1A - In a set of student evaluations of their...Ch. 10.1A - If a bar graph like the one shown here were used...Ch. 10.1A - Prob. 16ACh. 10.1B - Assessment To study the effect of student...Ch. 10.1B - Assessment If students are measuring a tablespoon...Ch. 10.1B - Assessment If third graders were measuring an...Ch. 10.1B - Assessment To determine student computer use,...Ch. 10.1B - Suppose a poll is to be conducted in an elementary...Ch. 10.1B - Determine the population and the sample in the...Ch. 10.1B - A second-grade class has a project to determine...Ch. 10.1B - An elementary school class decides to determine...Ch. 10.1B - Prob. 12ACh. 10.1B - Prob. 13ACh. 10.1B - Assessment A university professor used a rating...Ch. 10.1B - Prob. 15ACh. 10.2 - Mathematical Connections a. Discuss when a...Ch. 10.2 - Mathematical Connections Explain whether a circle...Ch. 10.2 - Mathematical Connections Explain why the sum of...Ch. 10.2 - Mathematical Connections The federal budget for...Ch. 10.2 - Mathematical Connections Tell whether it is...Ch. 10.2 - Mathematical Connections Car sales from 1990 to...Ch. 10.2 - Mathematical Connections Find five examples of...Ch. 10.2 - Mathematical Connections A graph similar to the...Ch. 10.2 - Mathematical Connections Vale asks whether a stem...Ch. 10.2 - Mathematical Connections A histogram of the data...Ch. 10.2 - Mathematical Connections Paul asks how to create a...Ch. 10.2 - Mathematical Connections On the School Book Page...Ch. 10.2 - Prob. 15MCCh. 10.2 - Answer the Try It on the School Book Page on page...Ch. 10.2 - Answer the Try It on the School Book Page on page...Ch. 10.2 - National Assessment of Educational Progress NAEP...Ch. 10.2 - National Assessment of Educational Progress NAEP...Ch. 10.2 - National Assessment of Educational Progress NAEP...Ch. 10.2 - National Assessment of Educational Progress NAEP...Ch. 10.2 - National Assessment of Educational Progress NAEP...Ch. 10.2A - The following the pictograph shows the approximate...Ch. 10.2A - Prob. 2ACh. 10.2A - Prob. 3ACh. 10.2A - Sixth grade students reported the numbers of apps...Ch. 10.2A - Prob. 5ACh. 10.2A - Prob. 6ACh. 10.2A - Prob. 7ACh. 10.2A - Prob. 8ACh. 10.2A - Prob. 9ACh. 10.2A - Prob. 10ACh. 10.2A - Prob. 11ACh. 10.2A - Prob. 12ACh. 10.2A - Prob. 13ACh. 10.2A - a. A 2-inch-long rectangle serves as a percentage...Ch. 10.2A - Seniors Sierra High were asked to about their...Ch. 10.2A - Prob. 16ACh. 10.2A - Prob. 17ACh. 10.2A - Prob. 18ACh. 10.2B - The following pictograph shows the approximate...Ch. 10.2B - Display the following information about the status...Ch. 10.2B - In the figure shown, monthly sales of three...Ch. 10.2B - Prob. 4ACh. 10.2B - A list of presidents, with the number of children...Ch. 10.2B - Prob. 6ACh. 10.2B - The heights reached by 15 model rockets launched...Ch. 10.2B - Prob. 8ACh. 10.2B - Given the following bar graph, estimate the length...Ch. 10.2B - Prob. 10ACh. 10.2B - Prob. 11ACh. 10.2B - The graph below shows the number of books read by...Ch. 10.2B - Prob. 13ACh. 10.2B - Use the circle graph to answer the following...Ch. 10.2B - a. In a circle graph, a sector containing 82...Ch. 10.2B - A percentage bar graph with 100 is drawn to depict...Ch. 10.2B - Prob. 17ACh. 10.2B - Prob. 18ACh. 10.3 - Explain the concept of association as it is...Ch. 10.3 - Jacquie argued that scatterplots had little value...Ch. 10.3 - Prob. 6MCCh. 10.3 - The Garcia family drew a circle graph of their...Ch. 10.3 - Prob. 9MCCh. 10.3 - Prob. 10MCCh. 10.3 - A teacher surveyed 8 students in a class to find...Ch. 10.3 - Prob. 2NAEPCh. 10.3A - Assessment The graph below shows the population of...Ch. 10.3A - Assessment The graph shows the number of snow...Ch. 10.3A - Assessment The graph shows the US rates of adult...Ch. 10.3A - Prob. 5ACh. 10.3A - Prob. 6ACh. 10.3A - Prob. 7ACh. 10.3A - Assessment Consider an arithmetic sequence with...Ch. 10.3A - Prob. 9ACh. 10.3A - Assessment In the following scatterplots, find an...Ch. 10.3A - Assessment The following data show the amount of...Ch. 10.3A - Assessment If a trend line has equation...Ch. 10.3A - Assessment If a trend line has equation y=150.8x,...Ch. 10.3A - Assessment For each of the following pairs of...Ch. 10.3B - Prob. 1ACh. 10.3B - Prob. 2ACh. 10.3B - Prob. 3ACh. 10.3B - Prob. 4ACh. 10.3B - Prob. 5ACh. 10.3B - Prob. 6ACh. 10.3B - Prob. 7ACh. 10.3B - Prob. 8ACh. 10.3B - Prob. 9ACh. 10.3B - Prob. 10ACh. 10.3B - Prob. 11ACh. 10.3B - Prob. 12ACh. 10.3B - Prob. 13ACh. 10.3B - Assessment If a trend line has equation...Ch. 10.3B - Assessment For each of the following pairs of...Ch. 10.4 - Mathematical Connections Karl had scores of...Ch. 10.4 - The mean of the five numbers given is 50: 20 35 50...Ch. 10.4 - Prob. 6MCCh. 10.4 - Mathematical Connections Explain why the mode...Ch. 10.4 - Prob. 8MCCh. 10.4 - Mathematical Connections The mean of 5,7,9 is 7....Ch. 10.4 - Mathematical Connections If each number in a set...Ch. 10.4 - Mathematical Connections What does a large...Ch. 10.4 - Mathematical Connections In each pair of variables...Ch. 10.4 - Mathematical Connections Use the data in the...Ch. 10.4 - Mathematical Connections A student asks, If the...Ch. 10.4 - Mathematical Connections Jose asks, Why can a...Ch. 10.4 - Mathematical Connections Suppose the class takes a...Ch. 10.4 - Mathematical Connections A student asks if it is...Ch. 10.4 - Prob. 19MCCh. 10.4 - Mathematical Connections A student asks if it is...Ch. 10.4 - Mathematical Connections Mels mean on 10 tests for...Ch. 10.4 - Mathematical Connections On the School Book Page,...Ch. 10.4 - Prob. 25MCCh. 10.4 - Mathematical Connections Given the bar graph...Ch. 10.4 - Mathematical Connections Refer to the following...Ch. 10.4 - Mathematical Connections Following are raw test...Ch. 10.4 - Josephs current test scores, in points, are 83,...Ch. 10.4 - National Assessment of Educational Progress NAEP...Ch. 10.4 - Prob. 3NAEPCh. 10.4 - Richard wants to estimate the average mean monthly...Ch. 10.4A - Assessment Calculate the mean, the median, and the...Ch. 10.4A - Prob. 2ACh. 10.4A - Assessment a. If three students scored 75 on a...Ch. 10.4A - Prob. 4ACh. 10.4A - Assessment Suppose in Selinas class there were...Ch. 10.4A - Prob. 6ACh. 10.4A - Prob. 7ACh. 10.4A - Prob. 8ACh. 10.4A - Prob. 9ACh. 10.4A - Prob. 10ACh. 10.4A - Prob. 11ACh. 10.4A - Assessment The city of Podunk advertised itself as...Ch. 10.4A - Prob. 13ACh. 10.4A - Prob. 14ACh. 10.4A - Prob. 15ACh. 10.4A - Assessment Following are box plots comparing the...Ch. 10.4A - Prob. 17ACh. 10.4A - Assessment The following table shows the heights...Ch. 10.4A - Assessment What is the standard deviation of the...Ch. 10.4A - Prob. 20ACh. 10.4A - Prob. 21ACh. 10.4A - Assessment The average phone call in a certain...Ch. 10.4A - Prob. 23ACh. 10.4A - Prob. 24ACh. 10.4A - Prob. 25ACh. 10.4A - Prob. 26ACh. 10.4A - Prob. 27ACh. 10.4A - Prob. 28ACh. 10.4B - Calculate the mean, the median, and the mode for...Ch. 10.4B - Prob. 2ACh. 10.4B - Prob. 3ACh. 10.4B - Prob. 4ACh. 10.4B - Prob. 5ACh. 10.4B - Prob. 6ACh. 10.4B - Prob. 7ACh. 10.4B - Prob. 9ACh. 10.4B - Prob. 10ACh. 10.4B - Prob. 11ACh. 10.4B - Prob. 12ACh. 10.4B - Prob. 13ACh. 10.4B - Prob. 14ACh. 10.4B - Ginnys median score on three tests was 90. Her...Ch. 10.4B - Prob. 16ACh. 10.4B - Prob. 17ACh. 10.4B - The following table shows the heights in feet of...Ch. 10.4B - a. If all the numbers in a set are equal, what is...Ch. 10.4B - In a school system, teachers start at a salary of...Ch. 10.4B - Prob. 21ACh. 10.4B - Prob. 22ACh. 10.4B - Prob. 23ACh. 10.4B - Prob. 24ACh. 10.4B - The weights of newborn babies in a certain country...Ch. 10.4B - Prob. 26ACh. 10.4B - Prob. 27ACh. 10.4B - Prob. 28ACh. 10.4B - Prob. 29ACh. 10.CR - Suppose you read that the average family in...Ch. 10.CR - Prob. 2CRCh. 10.CR - Prob. 3CRCh. 10.CR - Prob. 5CRCh. 10.CR - Prob. 6CRCh. 10.CR - The budget for the Wegetem Crime Co. is 2,000,000....Ch. 10.CR - Prob. 8CRCh. 10.CR - Prob. 9CRCh. 10.CR - Prob. 11CRCh. 10.CR - Prob. 12CRCh. 10.CR - Prob. 13CRCh. 10.CR - Prob. 14CRCh. 10.CR - CHAPTER 10 REVIEW The following chart lists the...Ch. 10.CR - Prob. 16CRCh. 10.CR - Prob. 17CRCh. 10.CR - Prob. 19CRCh. 10.CR - Prob. 20CRCh. 10.CR - Prob. 21CRCh. 10.CR - Prob. 22CRCh. 10.CR - Prob. 24CRCh. 10.CR - CHAPTER 10 REVIEW Following are the record...Ch. 10.CR - Prob. 26CRCh. 10.CR - Prob. 27CRCh. 10.CR - Prob. 28CRCh. 10.CR - Prob. 29CRCh. 10.CR - Prob. 30CRCh. 10.CR - Prob. 32CRCh. 10.CR - CHAPTER 10 REVIEW Give examples of several ways to...Ch. 10.CR - Prob. 34CRCh. 10.CR - Prob. 35CRCh. 10.CR - Prob. 36CRCh. 10.CR - Prob. 37CRCh. 10 - Prob. 1NTCh. 10 - Prob. 2NTCh. 10 - Prob. 4NTCh. 10 - Prob. 5NTCh. 10 - Prob. 6NTCh. 10 - Prob. 7NTCh. 10 - Prob. 8NT
Knowledge Booster


Learn more about
Need a deep-dive on the concept behind this application? Look no further. Learn more about this topic, subject and related others by exploring similar questions and additional content below.Similar questions
- Construct a triangle in the Poincare plane with all sides equal to ln(2). (Hint: Use the fact that, the circle with center (0,a) and radius ln(r), r>1 in the Poincaré plane is equal to the point set { (x,y) : x^2+(y-1/2(r+1/r)a)^2=1/4(r-1/r)^2a^2 }arrow_forwardHow many different rectangles can be made whose side lengths, in centimeters, are counting numbers and whose are is 1,159 square centimeters? Draw and label all possible rectangles.arrow_forwardNot use ai pleasearrow_forward
- Task: 3 Numerical Analysis: Finite Element Method Refer to Question 43 in the provided document. Link: https://drive.google.com/file/d/1wKSrun-GlxirS31Z9qoHazb9tC440AZF/view?usp=sharingarrow_forward(a+b) R2L 2+2*0=? Ma state without proof the uniqueness theorm of probability function suppose thatPandQ are probability measures defined on the same probability space (Q, F)and that Fis generated by a π-system if P(A)=Q(A) tax for all A EthenP=Q i. e. P(A)=Q(A) for alla g // معدلة 2:23 صarrow_forward3. Construct a triangle in the Poincare plane with all sides equal to ln(2). (Hint: Use the fact that, the circle with center (0,a) and radius ln(r), r>1 in the Poincaré plane is equal to the point set { (x,y) : x^2+(y-1/2(r+1/r)a)^2=1/4(r-1/r)^2a^2 }arrow_forward
arrow_back_ios
SEE MORE QUESTIONS
arrow_forward_ios
Recommended textbooks for you
 Glencoe Algebra 1, Student Edition, 9780079039897...AlgebraISBN:9780079039897Author:CarterPublisher:McGraw Hill
 Big Ideas Math A Bridge To Success Algebra 1: Stu...AlgebraISBN:9781680331141Author:HOUGHTON MIFFLIN HARCOURTPublisher:Houghton Mifflin Harcourt
 Holt Mcdougal Larson Pre-algebra: Student Edition...AlgebraISBN:9780547587776Author:HOLT MCDOUGALPublisher:HOLT MCDOUGAL
 Trigonometry (MindTap Course List)TrigonometryISBN:9781305652224Author:Charles P. McKeague, Mark D. TurnerPublisher:Cengage Learning
Glencoe Algebra 1, Student Edition, 9780079039897...
Algebra
ISBN:9780079039897
Author:Carter
Publisher:McGraw Hill
Big Ideas Math A Bridge To Success Algebra 1: Stu...
Algebra
ISBN:9781680331141
Author:HOUGHTON MIFFLIN HARCOURT
Publisher:Houghton Mifflin Harcourt
Holt Mcdougal Larson Pre-algebra: Student Edition...
Algebra
ISBN:9780547587776
Author:HOLT MCDOUGAL
Publisher:HOLT MCDOUGAL
Trigonometry (MindTap Course List)
Trigonometry
ISBN:9781305652224
Author:Charles P. McKeague, Mark D. Turner
Publisher:Cengage Learning
Which is the best chart: Selecting among 14 types of charts Part II; Author: 365 Data Science;https://www.youtube.com/watch?v=qGaIB-bRn-A;License: Standard YouTube License, CC-BY