
A Problem Solving Approach To Mathematics For Elementary School Teachers (13th Edition)
13th Edition
ISBN: 9780135183885
Author: Rick Billstein, Shlomo Libeskind, Johnny Lott, Barbara Boschmans
Publisher: PEARSON
expand_more
expand_more
format_list_bulleted
Concept explainers
Videos
Textbook Question
Chapter 10.2, Problem 1NAEP
National Assessment of Educational Progress (NAEP)
The graph below shows students’ favorite fruits.
Use these clues to label the bars with the correct fruit.
Twice as many students chose apples as grapes.
Five more students chose peaches than apples.
Ten more students chose bananas than peaches.
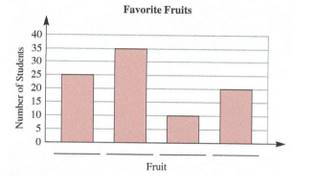
Write the correct fruit on the line above.
Expert Solution & Answer
Want to see the full answer?
Check out a sample textbook solution
Students have asked these similar questions
Example:
If ƒ (x + 2π) = ƒ (x), find the Fourier expansion f(x) = eax in the interval
[−π,π]
Please can you give detailed steps on how the solutions change from complex form to real form. Thanks.
Examples: Solve the following differential equation using Laplace transform
(e) ty"-ty+y=0 with y(0) = 0, and y'(0) = 1
Chapter 10 Solutions
A Problem Solving Approach To Mathematics For Elementary School Teachers (13th Edition)
Ch. 10.1 - Suggest how students at different grades might...Ch. 10.1 - Mathematical Connections What are the Nielsen...Ch. 10.1 - Prob. 4MCCh. 10.1 - Read about basic ideas of statistics in Common...Ch. 10.1 - National Assessment of Educational ProgressNAEP...Ch. 10.1 - Prob. 2NAEPCh. 10.1 - Prob. 3NAEPCh. 10.1A - If one wanted to study the effect of using a...Ch. 10.1A - Prob. 2ACh. 10.1A - Prob. 3A
Ch. 10.1A - Prob. 4ACh. 10.1A - Prob. 5ACh. 10.1A - Prob. 6ACh. 10.1A - A second-grade class has a project to determine...Ch. 10.1A - Prob. 8ACh. 10.1A - Prob. 9ACh. 10.1A - Decide whether each of the following questions is...Ch. 10.1A - Prob. 11ACh. 10.1A - If a class were to investigate how many countries...Ch. 10.1A - Prob. 13ACh. 10.1A - In a set of student evaluations of their...Ch. 10.1A - If a bar graph like the one shown here were used...Ch. 10.1A - Prob. 16ACh. 10.1B - Assessment To study the effect of student...Ch. 10.1B - Assessment If students are measuring a tablespoon...Ch. 10.1B - Assessment If third graders were measuring an...Ch. 10.1B - Assessment To determine student computer use,...Ch. 10.1B - Suppose a poll is to be conducted in an elementary...Ch. 10.1B - Determine the population and the sample in the...Ch. 10.1B - A second-grade class has a project to determine...Ch. 10.1B - An elementary school class decides to determine...Ch. 10.1B - Prob. 12ACh. 10.1B - Prob. 13ACh. 10.1B - Assessment A university professor used a rating...Ch. 10.1B - Prob. 15ACh. 10.2 - Mathematical Connections a. Discuss when a...Ch. 10.2 - Mathematical Connections Explain whether a circle...Ch. 10.2 - Mathematical Connections Explain why the sum of...Ch. 10.2 - Mathematical Connections The federal budget for...Ch. 10.2 - Mathematical Connections Tell whether it is...Ch. 10.2 - Mathematical Connections Car sales from 1990 to...Ch. 10.2 - Mathematical Connections Find five examples of...Ch. 10.2 - Mathematical Connections A graph similar to the...Ch. 10.2 - Mathematical Connections Vale asks whether a stem...Ch. 10.2 - Mathematical Connections A histogram of the data...Ch. 10.2 - Mathematical Connections Paul asks how to create a...Ch. 10.2 - Mathematical Connections On the School Book Page...Ch. 10.2 - Prob. 15MCCh. 10.2 - Answer the Try It on the School Book Page on page...Ch. 10.2 - Answer the Try It on the School Book Page on page...Ch. 10.2 - National Assessment of Educational Progress NAEP...Ch. 10.2 - National Assessment of Educational Progress NAEP...Ch. 10.2 - National Assessment of Educational Progress NAEP...Ch. 10.2 - National Assessment of Educational Progress NAEP...Ch. 10.2 - National Assessment of Educational Progress NAEP...Ch. 10.2A - The following the pictograph shows the approximate...Ch. 10.2A - Prob. 2ACh. 10.2A - Prob. 3ACh. 10.2A - Sixth grade students reported the numbers of apps...Ch. 10.2A - Prob. 5ACh. 10.2A - Prob. 6ACh. 10.2A - Prob. 7ACh. 10.2A - Prob. 8ACh. 10.2A - Prob. 9ACh. 10.2A - Prob. 10ACh. 10.2A - Prob. 11ACh. 10.2A - Prob. 12ACh. 10.2A - Prob. 13ACh. 10.2A - a. A 2-inch-long rectangle serves as a percentage...Ch. 10.2A - Seniors Sierra High were asked to about their...Ch. 10.2A - Prob. 16ACh. 10.2A - Prob. 17ACh. 10.2A - Prob. 18ACh. 10.2B - The following pictograph shows the approximate...Ch. 10.2B - Display the following information about the status...Ch. 10.2B - In the figure shown, monthly sales of three...Ch. 10.2B - Prob. 4ACh. 10.2B - A list of presidents, with the number of children...Ch. 10.2B - Prob. 6ACh. 10.2B - The heights reached by 15 model rockets launched...Ch. 10.2B - Prob. 8ACh. 10.2B - Given the following bar graph, estimate the length...Ch. 10.2B - Prob. 10ACh. 10.2B - Prob. 11ACh. 10.2B - The graph below shows the number of books read by...Ch. 10.2B - Prob. 13ACh. 10.2B - Use the circle graph to answer the following...Ch. 10.2B - a. In a circle graph, a sector containing 82...Ch. 10.2B - A percentage bar graph with 100 is drawn to depict...Ch. 10.2B - Prob. 17ACh. 10.2B - Prob. 18ACh. 10.3 - Explain the concept of association as it is...Ch. 10.3 - Jacquie argued that scatterplots had little value...Ch. 10.3 - Prob. 6MCCh. 10.3 - The Garcia family drew a circle graph of their...Ch. 10.3 - Prob. 9MCCh. 10.3 - Prob. 10MCCh. 10.3 - A teacher surveyed 8 students in a class to find...Ch. 10.3 - Prob. 2NAEPCh. 10.3A - Assessment The graph below shows the population of...Ch. 10.3A - Assessment The graph shows the number of snow...Ch. 10.3A - Assessment The graph shows the US rates of adult...Ch. 10.3A - Prob. 5ACh. 10.3A - Prob. 6ACh. 10.3A - Prob. 7ACh. 10.3A - Assessment Consider an arithmetic sequence with...Ch. 10.3A - Prob. 9ACh. 10.3A - Assessment In the following scatterplots, find an...Ch. 10.3A - Assessment The following data show the amount of...Ch. 10.3A - Assessment If a trend line has equation...Ch. 10.3A - Assessment If a trend line has equation y=150.8x,...Ch. 10.3A - Assessment For each of the following pairs of...Ch. 10.3B - Prob. 1ACh. 10.3B - Prob. 2ACh. 10.3B - Prob. 3ACh. 10.3B - Prob. 4ACh. 10.3B - Prob. 5ACh. 10.3B - Prob. 6ACh. 10.3B - Prob. 7ACh. 10.3B - Prob. 8ACh. 10.3B - Prob. 9ACh. 10.3B - Prob. 10ACh. 10.3B - Prob. 11ACh. 10.3B - Prob. 12ACh. 10.3B - Prob. 13ACh. 10.3B - Assessment If a trend line has equation...Ch. 10.3B - Assessment For each of the following pairs of...Ch. 10.4 - Mathematical Connections Karl had scores of...Ch. 10.4 - The mean of the five numbers given is 50: 20 35 50...Ch. 10.4 - Prob. 6MCCh. 10.4 - Mathematical Connections Explain why the mode...Ch. 10.4 - Prob. 8MCCh. 10.4 - Mathematical Connections The mean of 5,7,9 is 7....Ch. 10.4 - Mathematical Connections If each number in a set...Ch. 10.4 - Mathematical Connections What does a large...Ch. 10.4 - Mathematical Connections In each pair of variables...Ch. 10.4 - Mathematical Connections Use the data in the...Ch. 10.4 - Mathematical Connections A student asks, If the...Ch. 10.4 - Mathematical Connections Jose asks, Why can a...Ch. 10.4 - Mathematical Connections Suppose the class takes a...Ch. 10.4 - Mathematical Connections A student asks if it is...Ch. 10.4 - Prob. 19MCCh. 10.4 - Mathematical Connections A student asks if it is...Ch. 10.4 - Mathematical Connections Mels mean on 10 tests for...Ch. 10.4 - Mathematical Connections On the School Book Page,...Ch. 10.4 - Prob. 25MCCh. 10.4 - Mathematical Connections Given the bar graph...Ch. 10.4 - Mathematical Connections Refer to the following...Ch. 10.4 - Mathematical Connections Following are raw test...Ch. 10.4 - Josephs current test scores, in points, are 83,...Ch. 10.4 - National Assessment of Educational Progress NAEP...Ch. 10.4 - Prob. 3NAEPCh. 10.4 - Richard wants to estimate the average mean monthly...Ch. 10.4A - Assessment Calculate the mean, the median, and the...Ch. 10.4A - Prob. 2ACh. 10.4A - Assessment a. If three students scored 75 on a...Ch. 10.4A - Prob. 4ACh. 10.4A - Assessment Suppose in Selinas class there were...Ch. 10.4A - Prob. 6ACh. 10.4A - Prob. 7ACh. 10.4A - Prob. 8ACh. 10.4A - Prob. 9ACh. 10.4A - Prob. 10ACh. 10.4A - Prob. 11ACh. 10.4A - Assessment The city of Podunk advertised itself as...Ch. 10.4A - Prob. 13ACh. 10.4A - Prob. 14ACh. 10.4A - Prob. 15ACh. 10.4A - Assessment Following are box plots comparing the...Ch. 10.4A - Prob. 17ACh. 10.4A - Assessment The following table shows the heights...Ch. 10.4A - Assessment What is the standard deviation of the...Ch. 10.4A - Prob. 20ACh. 10.4A - Prob. 21ACh. 10.4A - Assessment The average phone call in a certain...Ch. 10.4A - Prob. 23ACh. 10.4A - Prob. 24ACh. 10.4A - Prob. 25ACh. 10.4A - Prob. 26ACh. 10.4A - Prob. 27ACh. 10.4A - Prob. 28ACh. 10.4B - Calculate the mean, the median, and the mode for...Ch. 10.4B - Prob. 2ACh. 10.4B - Prob. 3ACh. 10.4B - Prob. 4ACh. 10.4B - Prob. 5ACh. 10.4B - Prob. 6ACh. 10.4B - Prob. 7ACh. 10.4B - Prob. 9ACh. 10.4B - Prob. 10ACh. 10.4B - Prob. 11ACh. 10.4B - Prob. 12ACh. 10.4B - Prob. 13ACh. 10.4B - Prob. 14ACh. 10.4B - Ginnys median score on three tests was 90. Her...Ch. 10.4B - Prob. 16ACh. 10.4B - Prob. 17ACh. 10.4B - The following table shows the heights in feet of...Ch. 10.4B - a. If all the numbers in a set are equal, what is...Ch. 10.4B - In a school system, teachers start at a salary of...Ch. 10.4B - Prob. 21ACh. 10.4B - Prob. 22ACh. 10.4B - Prob. 23ACh. 10.4B - Prob. 24ACh. 10.4B - The weights of newborn babies in a certain country...Ch. 10.4B - Prob. 26ACh. 10.4B - Prob. 27ACh. 10.4B - Prob. 28ACh. 10.4B - Prob. 29ACh. 10.CR - Suppose you read that the average family in...Ch. 10.CR - Prob. 2CRCh. 10.CR - Prob. 3CRCh. 10.CR - Prob. 5CRCh. 10.CR - Prob. 6CRCh. 10.CR - The budget for the Wegetem Crime Co. is 2,000,000....Ch. 10.CR - Prob. 8CRCh. 10.CR - Prob. 9CRCh. 10.CR - Prob. 11CRCh. 10.CR - Prob. 12CRCh. 10.CR - Prob. 13CRCh. 10.CR - Prob. 14CRCh. 10.CR - CHAPTER 10 REVIEW The following chart lists the...Ch. 10.CR - Prob. 16CRCh. 10.CR - Prob. 17CRCh. 10.CR - Prob. 19CRCh. 10.CR - Prob. 20CRCh. 10.CR - Prob. 21CRCh. 10.CR - Prob. 22CRCh. 10.CR - Prob. 24CRCh. 10.CR - CHAPTER 10 REVIEW Following are the record...Ch. 10.CR - Prob. 26CRCh. 10.CR - Prob. 27CRCh. 10.CR - Prob. 28CRCh. 10.CR - Prob. 29CRCh. 10.CR - Prob. 30CRCh. 10.CR - Prob. 32CRCh. 10.CR - CHAPTER 10 REVIEW Give examples of several ways to...Ch. 10.CR - Prob. 34CRCh. 10.CR - Prob. 35CRCh. 10.CR - Prob. 36CRCh. 10.CR - Prob. 37CRCh. 10 - Prob. 1NTCh. 10 - Prob. 2NTCh. 10 - Prob. 4NTCh. 10 - Prob. 5NTCh. 10 - Prob. 6NTCh. 10 - Prob. 7NTCh. 10 - Prob. 8NT
Knowledge Booster


Learn more about
Need a deep-dive on the concept behind this application? Look no further. Learn more about this topic, subject and related others by exploring similar questions and additional content below.Similar questions
- Examples: Solve the following differential equation using Laplace transform (a) y" +2y+y=t with y(0) = 0, and y'(0) = 1arrow_forwardTemperature for Sudbury (degrees Celsius) 3. The following table gives the mean monthly temperatures for Sudbury, Ontario and Windsor, Ontario. Each month is represented by the day of the year in the middle of the month. Month Day of Year Temperature for Windsor (degrees Celsius) January 15 -13.7 -4.7 February 45 -11.9 -3.8 March 75 -5.9 2.3 April 106 3.0 8.7 May 136 10.6 14.6 June 167 15.8 20.2 July 197 18.9 22.6 August 228 17.4 22.0 September 259 12.2 17.9 October 289 6.2 11.5 November 320 -1.2 4.8 December 350 -10.1 -1.2 a) Create a scatter plot of temperature vs. day of the year for each city. b) Draw the curve of best fit for each graph. c) Use your graphs to estimate when the temperature increases fastest, for each set of temperature data. Explain how you determined these values. d) Use your graphs to estimate the rate at which the temperature is increasing at the two times from question 3. e) Determine an equation of a sinusoidal function to model the data for each cityarrow_forwardNot use ai pleasearrow_forward
- π 25. If lies in the interval <0arrow_forward1 1+x 26. Derive the formula: tanhx=-In- 2 1-x ; x<1arrow_forward. Solve the equation for x ; tanh x = 3/5 .arrow_forwardIf is a scalar or invariant, , are vectors then is a mixed tensor of type (2, 1).arrow_forwardProve that the Abomian Method (ABM) and homotopy Method (HPM) are equivalent for solving nonlinear dis Serential equations. What the relationship between AdoMian (ADM) and Dafter Dar Jafari Method.arrow_forwardWhat is the relationship between AdoMian decompoition method and homotopy Perturaba tion method with prove?arrow_forwardQuestion 3 [10 marks]. Suppose that X, Y and Z are statistically independent random variables, each of them with a x²(2) distribution. (a) Find the moment generating function of U = X + 3Y + Z. State clearly and justify all steps taken. (b) Calculate the expectation E(U) using the moment generating function.arrow_forwardPlease could you explain why 0.5 was added to each upper limpit of the intervals.Thanksarrow_forwardOpen Middle Problem #1: You can only use the digits 1 through 9 one time each in the seven boxes below. How can you arrange the digits to make the fraction multiplication problem true? 8.8.08 =arrow_forwardarrow_back_iosSEE MORE QUESTIONSarrow_forward_ios
Recommended textbooks for you
 Glencoe Algebra 1, Student Edition, 9780079039897...AlgebraISBN:9780079039897Author:CarterPublisher:McGraw Hill
 Holt Mcdougal Larson Pre-algebra: Student Edition...AlgebraISBN:9780547587776Author:HOLT MCDOUGALPublisher:HOLT MCDOUGAL
 Algebra: Structure And Method, Book 1AlgebraISBN:9780395977224Author:Richard G. Brown, Mary P. Dolciani, Robert H. Sorgenfrey, William L. ColePublisher:McDougal Littell
 Big Ideas Math A Bridge To Success Algebra 1: Stu...AlgebraISBN:9781680331141Author:HOUGHTON MIFFLIN HARCOURTPublisher:Houghton Mifflin Harcourt
Glencoe Algebra 1, Student Edition, 9780079039897...
Algebra
ISBN:9780079039897
Author:Carter
Publisher:McGraw Hill
Holt Mcdougal Larson Pre-algebra: Student Edition...
Algebra
ISBN:9780547587776
Author:HOLT MCDOUGAL
Publisher:HOLT MCDOUGAL
Algebra: Structure And Method, Book 1
Algebra
ISBN:9780395977224
Author:Richard G. Brown, Mary P. Dolciani, Robert H. Sorgenfrey, William L. Cole
Publisher:McDougal Littell
Big Ideas Math A Bridge To Success Algebra 1: Stu...
Algebra
ISBN:9781680331141
Author:HOUGHTON MIFFLIN HARCOURT
Publisher:Houghton Mifflin Harcourt
Which is the best chart: Selecting among 14 types of charts Part II; Author: 365 Data Science;https://www.youtube.com/watch?v=qGaIB-bRn-A;License: Standard YouTube License, CC-BY