Understandable Statistics: Concepts And Methods
12th Edition
ISBN: 9781337517508
Author: Charles Henry Brase, Corrinne Pellillo Brase
Publisher: Cengage Learning
expand_more
expand_more
format_list_bulleted
Textbook Question
Chapter 10.2, Problem 6P
For Problems 5–16, please provide the following information.
- (a) What is the level of significance? State the null and alternate hypotheses.
- (b) Find the value of the chi-square statistic for the sample. Are all the expected frequencies greater than 5? What sampling distribution will you use? What are the degrees of freedom?
- (c) Find or estimate the P-value of the sample test statistic.
- (d) Based on your answers in parts (a) to (c), will you reject or fail to reject the null hypothesis that the population fits the specified distribution of categories?
- (e) Interpret your conclusion in the context of the application.
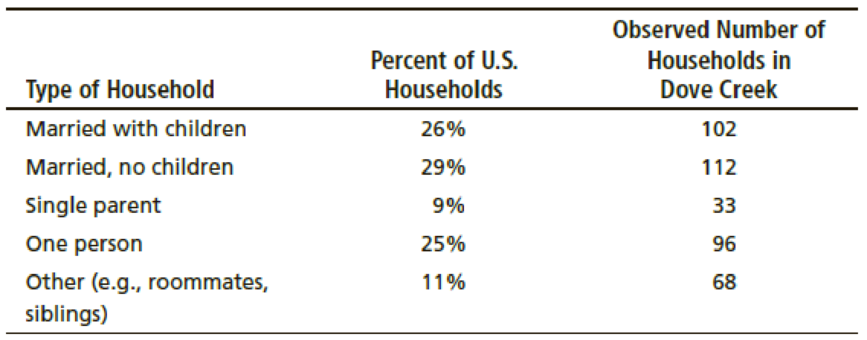
Census: Type of Household The type of household for the U.S. population and for a random sample of 411 households from the community of Dove Creek, Montana, are shown (based on Statistical Abstract of the United States).

Use a 5% level of significance to test the claim that the distribution of U.S. households fits the Dove Creek distribution.
Expert Solution & Answer
Want to see the full answer?
Check out a sample textbook solution
Students have asked these similar questions
Could you please help me with the following question.
Assume you did an experiment with 3 groups and 16 subjects per group. The sample variances in the three groups were 14, 16, and 18. Using Tukey's test to compare the means, what would be the value of Q for a comparison of the first mean (14) with the last mean (18)?
10
Chapter 10 Solutions
Understandable Statistics: Concepts And Methods
Ch. 10.1 - Statistical Literacy In general, are chi-square...Ch. 10.1 - Statistical Literacy For chi-square distributions,...Ch. 10.1 - Prob. 3PCh. 10.1 - Prob. 4PCh. 10.1 - Prob. 5PCh. 10.1 - Prob. 6PCh. 10.1 - Prob. 7PCh. 10.1 - Interpretation: Test of Independence Consider...Ch. 10.1 - Prob. 9PCh. 10.1 - For Problems 919, please provide the following...
Ch. 10.1 - Prob. 11PCh. 10.1 - For Problems 919, please provide the following...Ch. 10.1 - Prob. 13PCh. 10.1 - Prob. 14PCh. 10.1 - Prob. 15PCh. 10.1 - Prob. 16PCh. 10.1 - Prob. 17PCh. 10.1 - For Problems 919, please provide the following...Ch. 10.1 - Prob. 19PCh. 10.2 - Statistical Literacy For a chi-square...Ch. 10.2 - Prob. 2PCh. 10.2 - Statistical Literacy Explain why goodness-of-fit...Ch. 10.2 - Prob. 4PCh. 10.2 - For Problems 516, please provide the following...Ch. 10.2 - For Problems 516, please provide the following...Ch. 10.2 - Prob. 7PCh. 10.2 - For Problems 516, please provide the following...Ch. 10.2 - For Problems 516, please provide the following...Ch. 10.2 - For Problems 516, please provide the following...Ch. 10.2 - For Problems 516, please provide the following...Ch. 10.2 - For Problems 516, please provide the following...Ch. 10.2 - For Problems 516, please provide the following...Ch. 10.2 - Prob. 14PCh. 10.2 - Prob. 15PCh. 10.2 - Prob. 16PCh. 10.2 - Prob. 17PCh. 10.2 - Prob. 18PCh. 10.3 - Statistical Literacy Does the x distribution need...Ch. 10.3 - Critical Thinking The x distribution must be...Ch. 10.3 - Prob. 3PCh. 10.3 - For Problems 311, please provide the following...Ch. 10.3 - For Problems 311, please provide the following...Ch. 10.3 - For Problems 311, please provide the following...Ch. 10.3 - For Problems 311, please provide the following...Ch. 10.3 - For Problems 311, please provide the following...Ch. 10.3 - For Problems 311, please provide the following...Ch. 10.3 - For Problems 311, please provide the following...Ch. 10.3 - Prob. 11PCh. 10.4 - Prob. 1PCh. 10.4 - Statistical Literacy When using the F distribution...Ch. 10.4 - Prob. 3PCh. 10.4 - Prob. 4PCh. 10.4 - Prob. 5PCh. 10.4 - Prob. 6PCh. 10.4 - Prob. 7PCh. 10.4 - Prob. 8PCh. 10.4 - Prob. 9PCh. 10.4 - For Problems 512, please provide the following...Ch. 10.4 - Prob. 11PCh. 10.4 - Prob. 12PCh. 10.5 - In each problem, assume that the distributions are...Ch. 10.5 - Prob. 2PCh. 10.5 - Prob. 3PCh. 10.5 - Prob. 4PCh. 10.5 - Prob. 5PCh. 10.5 - Prob. 6PCh. 10.5 - Prob. 7PCh. 10.5 - Prob. 8PCh. 10.5 - Prob. 9PCh. 10.6 - Prob. 1PCh. 10.6 - Prob. 2PCh. 10.6 - Prob. 3PCh. 10.6 - Prob. 4PCh. 10.6 - Prob. 5PCh. 10.6 - Prob. 6PCh. 10.6 - Prob. 7PCh. 10 - Prob. 1CRPCh. 10 - Prob. 2CRPCh. 10 - Prob. 3CRPCh. 10 - Prob. 4CRPCh. 10 - Prob. 5CRPCh. 10 - Before you solve Problems 514, first classify the...Ch. 10 - Prob. 7CRPCh. 10 - Prob. 8CRPCh. 10 - Prob. 9CRPCh. 10 - Prob. 10CRPCh. 10 - Prob. 11CRPCh. 10 - Prob. 12CRPCh. 10 - Prob. 13CRPCh. 10 - Prob. 14CRPCh. 10 - Prob. 1DHCh. 10 - Prob. 1LCCh. 10 - Prob. 2LCCh. 10 - Prob. 1UTCh. 10 - Prob. 2UTCh. 10 - Prob. 3UT
Knowledge Booster
Learn more about
Need a deep-dive on the concept behind this application? Look no further. Learn more about this topic, statistics and related others by exploring similar questions and additional content below.Similar questions
- What is meant by the sample space of an experiment?arrow_forwardIn a 25-unit sample of a variable with a population average of 50, the Mean was 53 and the variance was 100. Which of the following is the test statistic for hypothesis testing? Please select one: a. 2.5 b. 1 c. 0.75 d. 3 e. 1.5arrow_forwardI’m doing some practice questions! Could you help me with this?arrow_forward
- The average age of the faculty at Preppy High’s main competitor, the Poindexter Academy, is 30 years of age. The Principal wants to know if her school’s faculty are older or younger. She has some age data from a random sample of 30 of her faculty. What statistical test should he use to analyze the data? a. One sample t-test b. One Way ANOVA c. Factorial ANOVA d. Independent Samples t-test e. Chi Square Test of Independencearrow_forward‘In 1996, 31% of students reported that their mothers had graduated college. In 2000, the percentage grew to 32%. The sample size used for both reports was 8368 students. What is the p-value?’arrow_forward1.A distribution of sample means with scores of 35 were taken from a skewed population. The distribution of sample means would also be skewed? true or false? 2. The larger the sample size, the smaller the standard error. true or false?arrow_forward
- Our professor wants us to calculate the test statistic and p-value by hand. The test statistic is correct. I can't get the p-value to save my life. Do you know what I am doing wrong?? (All of these p-value answers are incorrect: 0.25, .1230, 2.32, .0232, .02, and .01) An article published in the Washington Post claims that 45 percent of all Americans have brown eyes. A random sample of ?=78 college students found 30 who had brown eyes.Consider testing ?0:?=.45??:?≠.45 (a) The test statistic is ? = -1.16 (b) P-value =arrow_forwardDr. Kijowski is concerned about student phone use, so she collects information on the number of text messages that each student sent on a particular day. The boxplot below shows the results. Based on the boxplot, which of the following is the most reasonable conclusion? a. There are more people with data values below the median than there are people with data values above the median. Selected:b. There are more people with data values between the first quartile and the median than there are people with data values between the median and the third quartile.This answer is incorrect. c. There are fewer people with data values between the first quartile and the median than there are people with data values between the median and the third quartile. d. There are approximately the same number of people with data values between the first quartile and the minimum as there are people with data values between the third quartile and the maximum. e. The data are less spread out between the…arrow_forwardI need help with questions 2 and 3arrow_forward
- With your sample of 25 inmates, you want to test if the population mean age is different from 40 at the .05 level. Is it going to be a one-tailed test, or a two-tailed test? A. One-tailed test B. Two-tailed testarrow_forwardHello, I need help answering the following questions. What type of question is this-estimation or hypothesis? What type of study is this sample data or experiment data? What type of data is this? Univariate or bivariate? Categorical or Numerical? How many samples or treatments? 490 undergraduate students at a state university in the southwestern region of the United States were surveyed. Each student in the sample was classified according to class standing (freshman, sophomore, junior, or senior) and body are category (body piercings only, tattoos only, both tattoos and body piercings, no body art). Use the data in the accompanying table to determine if there is an association between class standing and body art category. Assume that it is reasonable to regard the sample as representative of the students at this university. Use α = 0.01. Freshman Sophmore Junior Senior Body Piercings…arrow_forwardA manufacturer found that the crack pressure of their football helmets is normally distributed with a mean of 150 lbs, and a standard deviation of 11 lbs. If 28 helmets were randomly selected to be tested, find the probability that the crack pressures have a mean that is less than 145 lbs. O0.0051 0.0081 O 0.0451 0.3247arrow_forward
arrow_back_ios
SEE MORE QUESTIONS
arrow_forward_ios
Recommended textbooks for you
 Glencoe Algebra 1, Student Edition, 9780079039897...AlgebraISBN:9780079039897Author:CarterPublisher:McGraw Hill
 College Algebra (MindTap Course List)AlgebraISBN:9781305652231Author:R. David Gustafson, Jeff HughesPublisher:Cengage Learning

Glencoe Algebra 1, Student Edition, 9780079039897...
Algebra
ISBN:9780079039897
Author:Carter
Publisher:McGraw Hill

College Algebra (MindTap Course List)
Algebra
ISBN:9781305652231
Author:R. David Gustafson, Jeff Hughes
Publisher:Cengage Learning
Hypothesis Testing using Confidence Interval Approach; Author: BUM2413 Applied Statistics UMP;https://www.youtube.com/watch?v=Hq1l3e9pLyY;License: Standard YouTube License, CC-BY
Hypothesis Testing - Difference of Two Means - Student's -Distribution & Normal Distribution; Author: The Organic Chemistry Tutor;https://www.youtube.com/watch?v=UcZwyzwWU7o;License: Standard Youtube License