Videos
Many people mistakenly believe that the seasons are caused by the earth’s varying proximity to the sun. In fact, the distance from the earth to the sun varies only slightly during the year, and the seasons are caused by the tilt of the earth's axis. As the earth travels around the sun during the year, the tilt of the earth's axis causes the northern hemisphere to vary between being tilted toward the sun to being tilted away from the sun. Figure 10.50 shows the earth as seen at a certain time of year from a point in outer space located in the plane in which the earth rotates about the sun. The diagram shows that the earth's axis is tilted 23.5° from the perpendicular to the plane in which the earth rotates around the sun. Throughout this problem, assume that the sun rays are parallel to the plane of the page.
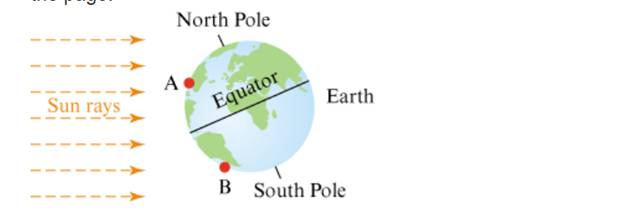
Figure 10.50 Earth and sun.
- Locations A and B in Figure 10.50 are shown at noon. Is the sun higher in the sky at noon at location A or at location B? Explain how you can tell.
- During the day, locations A and B will rotate around the axis through the North and South Poles. Compare the amount of sunlight that locations A and B will receive throughout the day. Which location will receive more sunlight during the day?
- Based on your answers to parts (a) and (b), what season is it in the northern hemisphere. and what season is it in the southern hemisphere in Figure 10.50 Explain.
- At another time of year, the earth and sun are positioned as shown in Figure 10.51 . At that time, what season is it in the northern and southern hemispheres? Why
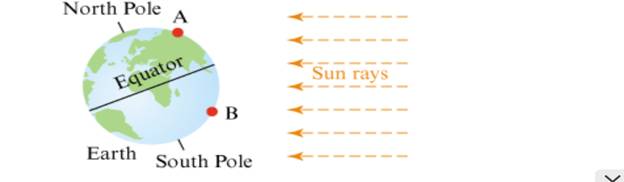
Flgure 10.51 Earth and sun at another time of year.
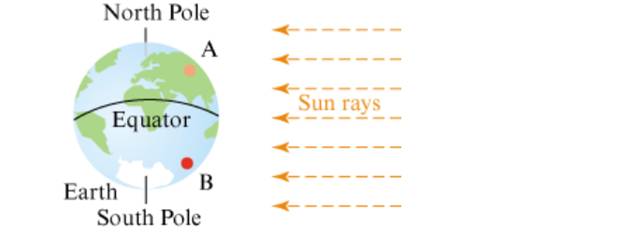
Figure 10.52 Earth and sun at another time of year.
Want to see the full answer?
Check out a sample textbook solution
Chapter 10 Solutions
Pearson eText for Mathematics for Elementary Teachers with Activities -- Instant Access (Pearson+)
Additional Math Textbook Solutions
Elementary Statistics Using The Ti-83/84 Plus Calculator, Books A La Carte Edition (5th Edition)
Pathways To Math Literacy (looseleaf)
Elementary Statistics: A Step By Step Approach
APPLIED STAT.IN BUS.+ECONOMICS
Finite Mathematics for Business, Economics, Life Sciences and Social Sciences
Precalculus: Mathematics for Calculus (Standalone Book)


- let h0, h1, h2,..., hn,....be the sequence defined by hn = (n C 2), (n choose 2). (n>=0). Determine the generating function for the sequence.arrow_forwardDraw the triangle and show all the workarrow_forwardThe average miles per gallon for a sample of 40 cars of model SX last year was 32.1, with a population standard deviation of 3.8. A sample of 40 cars from this year’s model SX has an average of 35.2 mpg, with a population standard deviation of 5.4. Find a 99 percent confidence interval for the difference in average mpg for this car brand (this year’s model minus last year’s).Find a 99 percent confidence interval for the difference in average mpg for last year’s model minus this year’s. What does the negative difference mean?arrow_forward
- A special interest group reports a tiny margin of error (plus or minus 0.04 percent) for its online survey based on 50,000 responses. Is the margin of error legitimate? (Assume that the group’s math is correct.)arrow_forwardSuppose that 73 percent of a sample of 1,000 U.S. college students drive a used car as opposed to a new car or no car at all. Find an 80 percent confidence interval for the percentage of all U.S. college students who drive a used car.What sample size would cut this margin of error in half?arrow_forwardYou want to compare the average number of tines on the antlers of male deer in two nearby metro parks. A sample of 30 deer from the first park shows an average of 5 tines with a population standard deviation of 3. A sample of 35 deer from the second park shows an average of 6 tines with a population standard deviation of 3.2. Find a 95 percent confidence interval for the difference in average number of tines for all male deer in the two metro parks (second park minus first park).Do the parks’ deer populations differ in average size of deer antlers?arrow_forward
- Suppose that you want to increase the confidence level of a particular confidence interval from 80 percent to 95 percent without changing the width of the confidence interval. Can you do it?arrow_forwardA random sample of 1,117 U.S. college students finds that 729 go home at least once each term. Find a 98 percent confidence interval for the proportion of all U.S. college students who go home at least once each term.arrow_forwardSuppose that you make two confidence intervals with the same data set — one with a 95 percent confidence level and the other with a 99.7 percent confidence level. Which interval is wider?Is a wide confidence interval a good thing?arrow_forward
 Elementary Geometry For College Students, 7eGeometryISBN:9781337614085Author:Alexander, Daniel C.; Koeberlein, Geralyn M.Publisher:Cengage,
 Elementary Geometry for College StudentsGeometryISBN:9781285195698Author:Daniel C. Alexander, Geralyn M. KoeberleinPublisher:Cengage Learning
 Mathematics For Machine TechnologyAdvanced MathISBN:9781337798310Author:Peterson, John.Publisher:Cengage Learning,
 Trigonometry (MindTap Course List)TrigonometryISBN:9781337278461Author:Ron LarsonPublisher:Cengage Learning
 Algebra & Trigonometry with Analytic GeometryAlgebraISBN:9781133382119Author:SwokowskiPublisher:Cengage
 Holt Mcdougal Larson Pre-algebra: Student Edition...AlgebraISBN:9780547587776Author:HOLT MCDOUGALPublisher:HOLT MCDOUGAL