
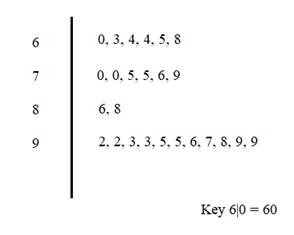
To plot: The stem plot for the data of resting pulse rates of members in the class.
The stem plot of the collected data is shown below
Concept used:
The stem plot is used to display a distribution in the graphical form of stem and leaves to study the shape of the distribution.
Calculation:
The data collected the resting pulse rates (beats per minute) for 25 students as shown below
| 92 | 64 | 96 | 92 | 68 | 70 | 95 | 99 | 75 | 88 |
| 86 | 65 | 76 | 98 | 97 | 79 | 95 | 60 | 63 | 64 |
| 70 | 75 | 99 | 93 | 93 |
The values of resting pulse rates (beats per minute) of 25 students range between 60 to 99, the leaf takes the unit’s place and the digit in ten’s place is written in the stem. For example, the key is
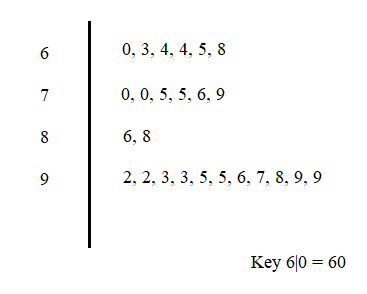
Interpretation:With reference to the stem plot, the data is skewed to the left, and considering the fact that the usual resting heartbeat ranges from 60 beats per minute to 100 beats per minute, there are no outliers in the collected data and it suggests that there are no abnormal heartbeats among the class students.
Chapter 10 Solutions
PRECALCULUS:...COMMON CORE ED.-W/ACCESS

- Use the information to find and compare Ay and dy. (Round your answers to four decimal places.) Function x-Value Differential of x Ду = dy = y = x² + 2 x = -4 Ax = dx = 0.01arrow_forwardCalculus lll May I please have the statements with blank lines completed; furthermore, may I please have the text box completed? Thank youarrow_forwardCalculus lll May I please have the statements completed for the following text lines and box? Thank you so much,arrow_forward
- Calculus lll May I please have the solution for the following exercise? Thank you so mucharrow_forwardCalculus lll May I please have the solution for the following exercise? Thank you so much,arrow_forwardCalculus lll May I please have the solution for the following exercise? Thank you so mucharrow_forward
- Calculus lll May I please have the solution for the following example? Thank youarrow_forwardCalculus lll May I please have the statement completed for the following box? Thank you so much,arrow_forwardCalculus lll May I please have the solution for the following exercise? Thank you so mucharrow_forward
- Use a graphing calculator to find where the curves intersect and to find the area between the curves. y=ex, y=-x²-4x a. The left point of intersection is (Type integers or decimals rounded to the nearest thousandth as needed. Type an ordered pair.)arrow_forwardFind the area between the curves. x= -5, x=3, y=2x² +9, y=0 The area between the curves is (Round to the nearest whole number as needed.)arrow_forwardcan you solve these questions with step by step with clear explaination pleasearrow_forward
 Calculus: Early TranscendentalsCalculusISBN:9781285741550Author:James StewartPublisher:Cengage Learning
 Thomas' Calculus (14th Edition)CalculusISBN:9780134438986Author:Joel R. Hass, Christopher E. Heil, Maurice D. WeirPublisher:PEARSON
 Calculus: Early Transcendentals (3rd Edition)CalculusISBN:9780134763644Author:William L. Briggs, Lyle Cochran, Bernard Gillett, Eric SchulzPublisher:PEARSON
 Calculus: Early TranscendentalsCalculusISBN:9781319050740Author:Jon Rogawski, Colin Adams, Robert FranzosaPublisher:W. H. Freeman
 Calculus: Early Transcendental FunctionsCalculusISBN:9781337552516Author:Ron Larson, Bruce H. EdwardsPublisher:Cengage Learning