
a.
To create: the frequency table for the given data.

Given information:
The average wind speeds for one year at 44 climatic data centers around the United States are as follows:
Concept Used:
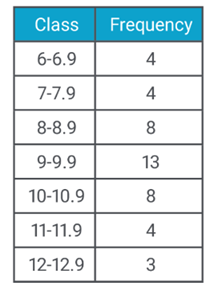
The number of leaves for a particular stem is the frequency of observations within each stem interval. Frequencies are often recorded in a frequency table.
Calculation:
The interval are
The frequency table is shown below:

b.
To complete: A stem plot diagram for the given data
Given information:
The average wind speeds for one year at 44 climatic data centers around the United States are as follows:
Concept Used:
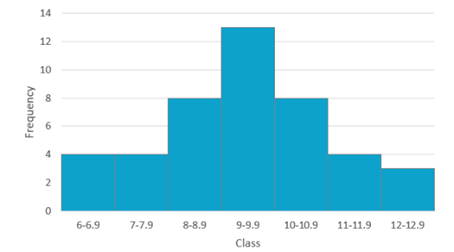
A histogram, closely related to a stem plot, displays the information of a frequency table
Calculation:
The frequency table is shown below:

By using the above data, the stem plot is shown below:

c.
To explain: the shape of distribution.
The histogram looks symmetric and a bell shape.
Given information:
The average wind speeds for one year at 44 climatic data centers around the United States are as follows:
Concept Used:
Calculation:
The frequency table is shown below:
By using the above data, the stem plot is shown below:

The histogram looks symmetric and a bell shape.
Chapter 10 Solutions
PRECALCULUS:...COMMON CORE ED.-W/ACCESS

- Calculus lll May I please have the statements completed for the following text lines and box? Thank you so much,arrow_forwardCalculus lll May I please have the solution for the following exercise? Thank you so mucharrow_forwardCalculus lll May I please have the solution for the following exercise? Thank you so much,arrow_forward
- Calculus lll May I please have the solution for the following exercise? Thank you so mucharrow_forwardCalculus lll May I please have the solution for the following example? Thank youarrow_forwardCalculus lll May I please have the statement completed for the following box? Thank you so much,arrow_forward
- Calculus lll May I please have the solution for the following exercise? Thank you so mucharrow_forwardUse a graphing calculator to find where the curves intersect and to find the area between the curves. y=ex, y=-x²-4x a. The left point of intersection is (Type integers or decimals rounded to the nearest thousandth as needed. Type an ordered pair.)arrow_forwardFind the area between the curves. x= -5, x=3, y=2x² +9, y=0 The area between the curves is (Round to the nearest whole number as needed.)arrow_forward
- can you solve these questions with step by step with clear explaination pleasearrow_forwardFind the area between the following curves. x=-1, x=3, y=x-1, and y=0 The area between the curves is (Simplify your answer.)arrow_forwardFind the area between the curves. x= − 2, x= 3, y=5x, y=x? - 6 6 The area between the curves is (Simplify your answer.) ...arrow_forward
 Calculus: Early TranscendentalsCalculusISBN:9781285741550Author:James StewartPublisher:Cengage Learning
 Thomas' Calculus (14th Edition)CalculusISBN:9780134438986Author:Joel R. Hass, Christopher E. Heil, Maurice D. WeirPublisher:PEARSON
 Calculus: Early Transcendentals (3rd Edition)CalculusISBN:9780134763644Author:William L. Briggs, Lyle Cochran, Bernard Gillett, Eric SchulzPublisher:PEARSON
 Calculus: Early TranscendentalsCalculusISBN:9781319050740Author:Jon Rogawski, Colin Adams, Robert FranzosaPublisher:W. H. Freeman
 Calculus: Early Transcendental FunctionsCalculusISBN:9781337552516Author:Ron Larson, Bruce H. EdwardsPublisher:Cengage Learning