
Bundle: Understandable Statistics: Concepts And Methods, 12th + Jmp Printed Access Card For Peck's Statistics + Webassign Printed Access Card For ... And Methods, 12th Edition, Single-term
12th Edition
ISBN: 9781337758925
Author: Charles Henry Brase, Corrinne Pellillo Brase
Publisher: Cengage Learning
expand_more
expand_more
format_list_bulleted
Videos
Textbook Question
Chapter 10.2, Problem 13P
For Problems 5–16, please provide the following information.
- (a) What is the level of significance? State the null and alternate hypotheses.
- (b) Find the value of the chi-square statistic for the sample. Are all the expected frequencies greater than 5? What sampling distribution will you use? What are the degrees of freedom?
- (c) Find or estimate the P-value of the sample test statistic.
- (d) Based on your answers in parts (a) to (c), will you reject or fail to reject the null hypothesis that the population fits the specified distribution of categories?
- (e) Interpret your conclusion in the context of the application.
Census: California The accuracy of a census report on a city in southern California was questioned by some government officials. A random sample of 1215 people living in the city was used to check the report, and the results are shown here:
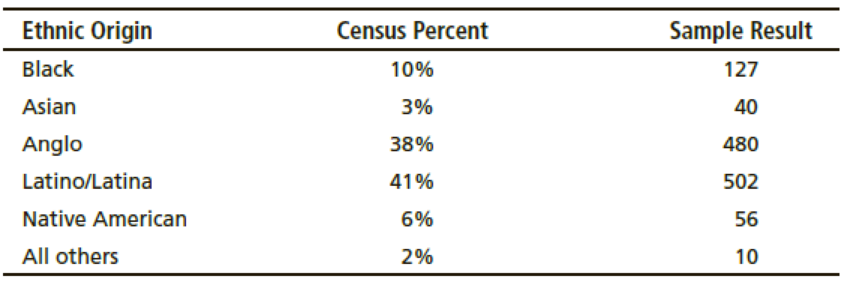
Using a 1% level of significance, test the claim that the census distribution and the sample distribution agree
Expert Solution & Answer
Want to see the full answer?
Check out a sample textbook solution
Students have asked these similar questions
Solve please and thank you!
7. In a 2011 article, M. Radelet and G. Pierce reported a logistic prediction equation
for the death penalty verdicts in North Carolina. Let Y denote whether a subject
convicted of murder received the death penalty (1=yes), for the defendant's race
h (h1, black; h = 2, white), victim's race i (i = 1, black; i = 2, white), and
number of additional factors j (j = 0, 1, 2). For the model
logit[P(Y = 1)] = a + ß₁₂ + By + B²²,
they reported = -5.26, D
â
BD
=
0, BD
=
0.17, BY = 0, BY
=
0.91, B = 0,
B = 2.02, B = 3.98.
(a) Estimate the probability of receiving the death penalty for the group most
likely to receive it. [4 pts]
(b) If, instead, parameters used constraints 3D = BY = 35 = 0, report the esti-
mates. [3 pts]
h
(c) If, instead, parameters used constraints Σ₁ = Σ₁ BY = Σ; B = 0, report
the estimates. [3 pts]
Hint the probabilities, odds and odds ratios do not change with constraints.
Solve please and thank you!
Chapter 10 Solutions
Bundle: Understandable Statistics: Concepts And Methods, 12th + Jmp Printed Access Card For Peck's Statistics + Webassign Printed Access Card For ... And Methods, 12th Edition, Single-term
Ch. 10.1 - Statistical Literacy In general, are chi-square...Ch. 10.1 - Statistical Literacy For chi-square distributions,...Ch. 10.1 - Prob. 3PCh. 10.1 - Prob. 4PCh. 10.1 - Prob. 5PCh. 10.1 - Prob. 6PCh. 10.1 - Prob. 7PCh. 10.1 - Interpretation: Test of Independence Consider...Ch. 10.1 - Prob. 9PCh. 10.1 - For Problems 919, please provide the following...
Ch. 10.1 - Prob. 11PCh. 10.1 - For Problems 919, please provide the following...Ch. 10.1 - Prob. 13PCh. 10.1 - Prob. 14PCh. 10.1 - Prob. 15PCh. 10.1 - Prob. 16PCh. 10.1 - Prob. 17PCh. 10.1 - For Problems 919, please provide the following...Ch. 10.1 - Prob. 19PCh. 10.2 - Statistical Literacy For a chi-square...Ch. 10.2 - Prob. 2PCh. 10.2 - Statistical Literacy Explain why goodness-of-fit...Ch. 10.2 - Prob. 4PCh. 10.2 - For Problems 516, please provide the following...Ch. 10.2 - For Problems 516, please provide the following...Ch. 10.2 - Prob. 7PCh. 10.2 - For Problems 516, please provide the following...Ch. 10.2 - For Problems 516, please provide the following...Ch. 10.2 - For Problems 516, please provide the following...Ch. 10.2 - For Problems 516, please provide the following...Ch. 10.2 - For Problems 516, please provide the following...Ch. 10.2 - For Problems 516, please provide the following...Ch. 10.2 - Prob. 14PCh. 10.2 - Prob. 15PCh. 10.2 - Prob. 16PCh. 10.2 - Prob. 17PCh. 10.2 - Prob. 18PCh. 10.3 - Statistical Literacy Does the x distribution need...Ch. 10.3 - Critical Thinking The x distribution must be...Ch. 10.3 - Prob. 3PCh. 10.3 - For Problems 311, please provide the following...Ch. 10.3 - For Problems 311, please provide the following...Ch. 10.3 - For Problems 311, please provide the following...Ch. 10.3 - For Problems 311, please provide the following...Ch. 10.3 - For Problems 311, please provide the following...Ch. 10.3 - For Problems 311, please provide the following...Ch. 10.3 - For Problems 311, please provide the following...Ch. 10.3 - Prob. 11PCh. 10.4 - Prob. 1PCh. 10.4 - Statistical Literacy When using the F distribution...Ch. 10.4 - Prob. 3PCh. 10.4 - Prob. 4PCh. 10.4 - Prob. 5PCh. 10.4 - Prob. 6PCh. 10.4 - Prob. 7PCh. 10.4 - Prob. 8PCh. 10.4 - Prob. 9PCh. 10.4 - For Problems 512, please provide the following...Ch. 10.4 - Prob. 11PCh. 10.4 - Prob. 12PCh. 10.5 - In each problem, assume that the distributions are...Ch. 10.5 - Prob. 2PCh. 10.5 - Prob. 3PCh. 10.5 - Prob. 4PCh. 10.5 - Prob. 5PCh. 10.5 - Prob. 6PCh. 10.5 - Prob. 7PCh. 10.5 - Prob. 8PCh. 10.5 - Prob. 9PCh. 10.6 - Prob. 1PCh. 10.6 - Prob. 2PCh. 10.6 - Prob. 3PCh. 10.6 - Prob. 4PCh. 10.6 - Prob. 5PCh. 10.6 - Prob. 6PCh. 10.6 - Prob. 7PCh. 10 - Prob. 1CRPCh. 10 - Prob. 2CRPCh. 10 - Prob. 3CRPCh. 10 - Prob. 4CRPCh. 10 - Prob. 5CRPCh. 10 - Before you solve Problems 514, first classify the...Ch. 10 - Prob. 7CRPCh. 10 - Prob. 8CRPCh. 10 - Prob. 9CRPCh. 10 - Prob. 10CRPCh. 10 - Prob. 11CRPCh. 10 - Prob. 12CRPCh. 10 - Prob. 13CRPCh. 10 - Prob. 14CRPCh. 10 - Prob. 1DHCh. 10 - Prob. 1LCCh. 10 - Prob. 2LCCh. 10 - Prob. 1UTCh. 10 - Prob. 2UTCh. 10 - Prob. 3UT
Knowledge Booster


Learn more about
Need a deep-dive on the concept behind this application? Look no further. Learn more about this topic, statistics and related others by exploring similar questions and additional content below.Similar questions
- Solve please and thank you!arrow_forwardQuestion 1:We want to evaluate the impact on the monetary economy for a company of two types of strategy (competitive strategy, cooperative strategy) adopted by buyers.Competitive strategy: strategy characterized by firm behavior aimed at obtaining concessions from the buyer.Cooperative strategy: a strategy based on a problem-solving negotiating attitude, with a high level of trust and cooperation.A random sample of 17 buyers took part in a negotiation experiment in which 9 buyers adopted the competitive strategy, and the other 8 the cooperative strategy. The savings obtained for each group of buyers are presented in the pdf that i sent: For this problem, we assume that the samples are random and come from two normal populations of unknown but equal variances.According to the theory, the average saving of buyers adopting a competitive strategy will be lower than that of buyers adopting a cooperative strategy.a) Specify the population identifications and the hypotheses H0 and H1…arrow_forwardYou assume that the annual incomes for certain workers are normal with a mean of $28,500 and a standard deviation of $2,400. What’s the chance that a randomly selected employee makes more than $30,000?What’s the chance that 36 randomly selected employees make more than $30,000, on average?arrow_forward
- What’s the chance that a fair coin comes up heads more than 60 times when you toss it 100 times?arrow_forwardSuppose that you have a normal population of quiz scores with mean 40 and standard deviation 10. Select a random sample of 40. What’s the chance that the mean of the quiz scores won’t exceed 45?Select one individual from the population. What’s the chance that his/her quiz score won’t exceed 45?arrow_forwardSuppose that you take a sample of 100 from a population that contains 45 percent Democrats. What sample size condition do you need to check here (if any)?What’s the standard error of ^P?Compare the standard errors of ^p n=100 for ,n=1000 , n=10,000, and comment.arrow_forward
- Suppose that a class’s test scores have a mean of 80 and standard deviation of 5. You choose 25 students from the class. What’s the chance that the group’s average test score is more than 82?arrow_forwardSuppose that you collect data on 10 products and check their weights. The average should be 10 ounces, but your sample mean is 9 ounces with standard deviation 2 ounces. Find the standard score.What percentile is the standard score found in part a of this question closest to?Suppose that the mean really is 10 ounces. Do you find these results unusual? Use probabilities to explain.arrow_forwardSuppose that you want to sample expensive computer chips, but you can have only n=3 of them. Should you continue the experiment?arrow_forward
- Suppose that studies claim that 40 percent of cellphone owners use their phones in the car while driving. What’s the chance that more than 425 out of a random sample of 1,000 cellphone owners say they use their phones while driving?arrow_forwardSuppose that the average length of stay in Europe for American tourists is 17 days, with standard deviation 4.5. You choose a random sample of 16 American tourists. The sample of 16 stay an average of 18.5 days or more. What’s the chance of that happening?arrow_forwardHow do you recognize that a statistical problem requires you to use the CLT? Think of one or two clues you can look for. (Assume quantitative data.)arrow_forward
arrow_back_ios
SEE MORE QUESTIONS
arrow_forward_ios
Recommended textbooks for you
 College Algebra (MindTap Course List)AlgebraISBN:9781305652231Author:R. David Gustafson, Jeff HughesPublisher:Cengage Learning
 Glencoe Algebra 1, Student Edition, 9780079039897...AlgebraISBN:9780079039897Author:CarterPublisher:McGraw Hill
College Algebra (MindTap Course List)
Algebra
ISBN:9781305652231
Author:R. David Gustafson, Jeff Hughes
Publisher:Cengage Learning
Glencoe Algebra 1, Student Edition, 9780079039897...
Algebra
ISBN:9780079039897
Author:Carter
Publisher:McGraw Hill
Hypothesis Testing using Confidence Interval Approach; Author: BUM2413 Applied Statistics UMP;https://www.youtube.com/watch?v=Hq1l3e9pLyY;License: Standard YouTube License, CC-BY
Hypothesis Testing - Difference of Two Means - Student's -Distribution & Normal Distribution; Author: The Organic Chemistry Tutor;https://www.youtube.com/watch?v=UcZwyzwWU7o;License: Standard Youtube License