
Bundle: Understandable Statistics: Concepts And Methods, 12th + Jmp Printed Access Card For Peck's Statistics + Webassign Printed Access Card For ... And Methods, 12th Edition, Single-term
12th Edition
ISBN: 9781337758925
Author: Charles Henry Brase, Corrinne Pellillo Brase
Publisher: Cengage Learning
expand_more
expand_more
format_list_bulleted
Videos
Textbook Question
Chapter 10.1, Problem 10P
For Problems 9–19, please provide the following information.
- (a) What is the level of significance? State the null and alternate hypotheses.
- (b) Find the value of the chi-square statistic for the sample. Are all the expected frequencies greater than 5? What sampling distribution will you use? What are the degrees of freedom?
- (c) Find or estimate the P-value of the sample test statistic.
- (d) Based on your answers in parts (a) to (c), will you reject or fail to reject the null hypothesis of independence?
- (e) Interpret your conclusion in the context of the application. Use the
expected values E to the hundredths place.
Psychology: Myers–Briggs The following table shows the Myers–Briggs personality preferences for a random sample of 519 people in the listed professions (Atlas of Type Tables by Macdaid, McCaulley, and Kainz). T refers to thinking and F refers to feeling.
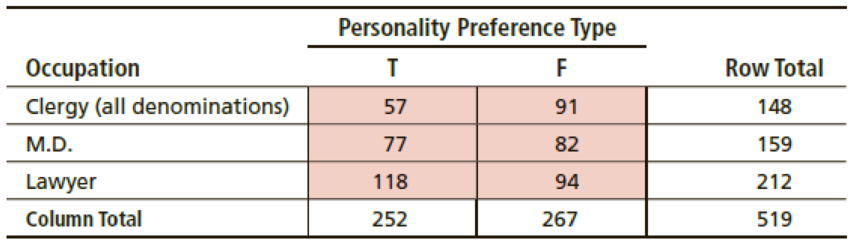
Use the chi-square test to determine if the listed occupations and personality preferences are independent at the 0.01 level of significance.
Expert Solution & Answer
Want to see the full answer?
Check out a sample textbook solution
Students have asked these similar questions
Sales personnel for Skillings Distributors submit weekly reports listing the customer contacts made during the week. A sample of 65 weekly reports showed a sample mean of 19.5 customer contacts per week. The sample standard deviation was 5.2. Provide 90% and 95% confidence intervals for the population mean number of weekly customer contacts for the sales personnel.
90% Confidence interval, to 2 decimals:
( , )
95% Confidence interval, to 2 decimals:
A simple random sample of 40 items resulted in a sample mean of 25. The population standard deviation is 5.
a. What is the standard error of the mean (to 2 decimals)?
b. At 95% confidence, what is the margin of error (to 2 decimals)?
mean trough level of the population to be 3.7 micrograms/mL. The researcher conducts a study among 93 newly diagnosed arthritis patients and finds the mean trough to be 4.1 micrograms/mL with a standard deviation of 2.4 micrograms/mL. The researcher wants to test at the 5% level of significance if the trough is different than previously reported or not. Z statistics will be used.
Complete Step 5 of hypothesis testing: Conclusion. State whether or not you would reject the null hypothesis and why. Also interpret what this means (i.e. is the mean trough different from 3.7 or no
Chapter 10 Solutions
Bundle: Understandable Statistics: Concepts And Methods, 12th + Jmp Printed Access Card For Peck's Statistics + Webassign Printed Access Card For ... And Methods, 12th Edition, Single-term
Ch. 10.1 - Statistical Literacy In general, are chi-square...Ch. 10.1 - Statistical Literacy For chi-square distributions,...Ch. 10.1 - Prob. 3PCh. 10.1 - Prob. 4PCh. 10.1 - Prob. 5PCh. 10.1 - Prob. 6PCh. 10.1 - Prob. 7PCh. 10.1 - Interpretation: Test of Independence Consider...Ch. 10.1 - Prob. 9PCh. 10.1 - For Problems 919, please provide the following...
Ch. 10.1 - Prob. 11PCh. 10.1 - For Problems 919, please provide the following...Ch. 10.1 - Prob. 13PCh. 10.1 - Prob. 14PCh. 10.1 - Prob. 15PCh. 10.1 - Prob. 16PCh. 10.1 - Prob. 17PCh. 10.1 - For Problems 919, please provide the following...Ch. 10.1 - Prob. 19PCh. 10.2 - Statistical Literacy For a chi-square...Ch. 10.2 - Prob. 2PCh. 10.2 - Statistical Literacy Explain why goodness-of-fit...Ch. 10.2 - Prob. 4PCh. 10.2 - For Problems 516, please provide the following...Ch. 10.2 - For Problems 516, please provide the following...Ch. 10.2 - Prob. 7PCh. 10.2 - For Problems 516, please provide the following...Ch. 10.2 - For Problems 516, please provide the following...Ch. 10.2 - For Problems 516, please provide the following...Ch. 10.2 - For Problems 516, please provide the following...Ch. 10.2 - For Problems 516, please provide the following...Ch. 10.2 - For Problems 516, please provide the following...Ch. 10.2 - Prob. 14PCh. 10.2 - Prob. 15PCh. 10.2 - Prob. 16PCh. 10.2 - Prob. 17PCh. 10.2 - Prob. 18PCh. 10.3 - Statistical Literacy Does the x distribution need...Ch. 10.3 - Critical Thinking The x distribution must be...Ch. 10.3 - Prob. 3PCh. 10.3 - For Problems 311, please provide the following...Ch. 10.3 - For Problems 311, please provide the following...Ch. 10.3 - For Problems 311, please provide the following...Ch. 10.3 - For Problems 311, please provide the following...Ch. 10.3 - For Problems 311, please provide the following...Ch. 10.3 - For Problems 311, please provide the following...Ch. 10.3 - For Problems 311, please provide the following...Ch. 10.3 - Prob. 11PCh. 10.4 - Prob. 1PCh. 10.4 - Statistical Literacy When using the F distribution...Ch. 10.4 - Prob. 3PCh. 10.4 - Prob. 4PCh. 10.4 - Prob. 5PCh. 10.4 - Prob. 6PCh. 10.4 - Prob. 7PCh. 10.4 - Prob. 8PCh. 10.4 - Prob. 9PCh. 10.4 - For Problems 512, please provide the following...Ch. 10.4 - Prob. 11PCh. 10.4 - Prob. 12PCh. 10.5 - In each problem, assume that the distributions are...Ch. 10.5 - Prob. 2PCh. 10.5 - Prob. 3PCh. 10.5 - Prob. 4PCh. 10.5 - Prob. 5PCh. 10.5 - Prob. 6PCh. 10.5 - Prob. 7PCh. 10.5 - Prob. 8PCh. 10.5 - Prob. 9PCh. 10.6 - Prob. 1PCh. 10.6 - Prob. 2PCh. 10.6 - Prob. 3PCh. 10.6 - Prob. 4PCh. 10.6 - Prob. 5PCh. 10.6 - Prob. 6PCh. 10.6 - Prob. 7PCh. 10 - Prob. 1CRPCh. 10 - Prob. 2CRPCh. 10 - Prob. 3CRPCh. 10 - Prob. 4CRPCh. 10 - Prob. 5CRPCh. 10 - Before you solve Problems 514, first classify the...Ch. 10 - Prob. 7CRPCh. 10 - Prob. 8CRPCh. 10 - Prob. 9CRPCh. 10 - Prob. 10CRPCh. 10 - Prob. 11CRPCh. 10 - Prob. 12CRPCh. 10 - Prob. 13CRPCh. 10 - Prob. 14CRPCh. 10 - Prob. 1DHCh. 10 - Prob. 1LCCh. 10 - Prob. 2LCCh. 10 - Prob. 1UTCh. 10 - Prob. 2UTCh. 10 - Prob. 3UT
Knowledge Booster


Learn more about
Need a deep-dive on the concept behind this application? Look no further. Learn more about this topic, statistics and related others by exploring similar questions and additional content below.Similar questions
- 30% of all college students major in STEM (Science, Technology, Engineering, and Math). If 48 college students are randomly selected, find the probability thata. Exactly 12 of them major in STEM. b. At most 17 of them major in STEM. c. At least 12 of them major in STEM. d. Between 9 and 13 (including 9 and 13) of them major in STEM.arrow_forward7% of all Americans live in poverty. If 40 Americans are randomly selected, find the probability thata. Exactly 4 of them live in poverty. b. At most 1 of them live in poverty. c. At least 1 of them live in poverty. d. Between 2 and 9 (including 2 and 9) of them live in poverty.arrow_forward48% of all violent felons in the prison system are repeat offenders. If 40 violent felons are randomly selected, find the probability that a. Exactly 18 of them are repeat offenders. b. At most 18 of them are repeat offenders. c. At least 18 of them are repeat offenders. d. Between 17 and 21 (including 17 and 21) of them are repeat offenders.arrow_forward
- Consider an MA(6) model with θ1 = 0.5, θ2 = −25, θ3 = 0.125, θ4 = −0.0625, θ5 = 0.03125, and θ6 = −0.015625. Find a much simpler model that has nearly the same ψ-weights.arrow_forwardLet {Yt} be an AR(2) process of the special form Yt = φ2Yt − 2 + et. Use first principles to find the range of values of φ2 for which the process is stationary.arrow_forwardDescribe the important characteristics of the autocorrelation function for the following models: (a) MA(1), (b) MA(2), (c) AR(1), (d) AR(2), and (e) ARMA(1,1).arrow_forward
- « CENGAGE MINDTAP Quiz: Chapter 38 Assignment: Quiz: Chapter 38 ips Questions ra1kw08h_ch38.15m 13. 14. 15. O Which sentence has modifiers in the correct place? O a. When called, she for a medical emergency responds quickly. b. Without giving away too much of the plot, Helena described the heroine's actions in the film. O c. Nearly the snakebite victim died before the proper antitoxin was injected. . O O 16 16. O 17. 18. O 19. O 20 20. 21 21. 22. 22 DS 23. 23 24. 25. O O Oarrow_forwardQuestions ra1kw08h_ch36.14m 12. 13. 14. 15. 16. Ӧ 17. 18. 19. OS 20. Two separate sentences need Oa. two separate subjects. Ob. two dependent clauses. c. one shared subject.arrow_forwardCustomers experiencing technical difficulty with their Internet cable service may call an 800 number for technical support. It takes the technician between 30 seconds and 11 minutes to resolve the problem. The distribution of this support time follows the uniform distribution. Required: a. What are the values for a and b in minutes? Note: Do not round your intermediate calculations. Round your answers to 1 decimal place. b-1. What is the mean time to resolve the problem? b-2. What is the standard deviation of the time? c. What percent of the problems take more than 5 minutes to resolve? d. Suppose we wish to find the middle 50% of the problem-solving times. What are the end points of these two times?arrow_forward
- Exercise 6-6 (Algo) (LO6-3) The director of admissions at Kinzua University in Nova Scotia estimated the distribution of student admissions for the fall semester on the basis of past experience. Admissions Probability 1,100 0.5 1,400 0.4 1,300 0.1 Click here for the Excel Data File Required: What is the expected number of admissions for the fall semester? Compute the variance and the standard deviation of the number of admissions. Note: Round your standard deviation to 2 decimal places.arrow_forward1. Find the mean of the x-values (x-bar) and the mean of the y-values (y-bar) and write/label each here: 2. Label the second row in the table using proper notation; then, complete the table. In the fifth and sixth columns, show the 'products' of what you're multiplying, as well as the answers. X y x minus x-bar y minus y-bar (x minus x-bar)(y minus y-bar) (x minus x-bar)^2 xy 16 20 34 4-2 5 2 3. Write the sums that represents Sxx and Sxy in the table, at the bottom of their respective columns. 4. Find the slope of the Regression line: bi = (simplify your answer) 5. Find the y-intercept of the Regression line, and then write the equation of the Regression line. Show your work. Then, BOX your final answer. Express your line as "y-hat equals...arrow_forwardApply STATA commands & submit the output for each question only when indicated below i. Generate the log of birthweight and family income of children. Name these new variables Ibwght & Ifaminc. Include the output of this code. ii. Apply the command sum with the detail option to the variable faminc. Note: you should find the 25th percentile value, the 50th percentile and the 75th percentile value of faminc from the output - you will need it to answer the next question Include the output of this code. iii. iv. Use the output from part ii of this question to Generate a variable called "high_faminc" that takes a value 1 if faminc is less than or equal to the 25th percentile, it takes the value 2 if faminc is greater than 25th percentile but less than or equal to the 50th percentile, it takes the value 3 if faminc is greater than 50th percentile but less than or equal to the 75th percentile, it takes the value 4 if faminc is greater than the 75th percentile. Include the outcome of this code…arrow_forward
arrow_back_ios
SEE MORE QUESTIONS
arrow_forward_ios
Recommended textbooks for you
 College Algebra (MindTap Course List)AlgebraISBN:9781305652231Author:R. David Gustafson, Jeff HughesPublisher:Cengage Learning
 Glencoe Algebra 1, Student Edition, 9780079039897...AlgebraISBN:9780079039897Author:CarterPublisher:McGraw Hill
College Algebra (MindTap Course List)
Algebra
ISBN:9781305652231
Author:R. David Gustafson, Jeff Hughes
Publisher:Cengage Learning
Glencoe Algebra 1, Student Edition, 9780079039897...
Algebra
ISBN:9780079039897
Author:Carter
Publisher:McGraw Hill
Hypothesis Testing using Confidence Interval Approach; Author: BUM2413 Applied Statistics UMP;https://www.youtube.com/watch?v=Hq1l3e9pLyY;License: Standard YouTube License, CC-BY
Hypothesis Testing - Difference of Two Means - Student's -Distribution & Normal Distribution; Author: The Organic Chemistry Tutor;https://www.youtube.com/watch?v=UcZwyzwWU7o;License: Standard Youtube License