
Essentials of Statistics Books a la carte Plus NEW MyLab Statistics with Pearson eText - Access Card Package (5th Edition)
5th Edition
ISBN: 9780133892697
Author: Mario F. Triola
Publisher: PEARSON
expand_more
expand_more
format_list_bulleted
Concept explainers
Videos
Textbook Question
Chapter 10.2, Problem 11BSC
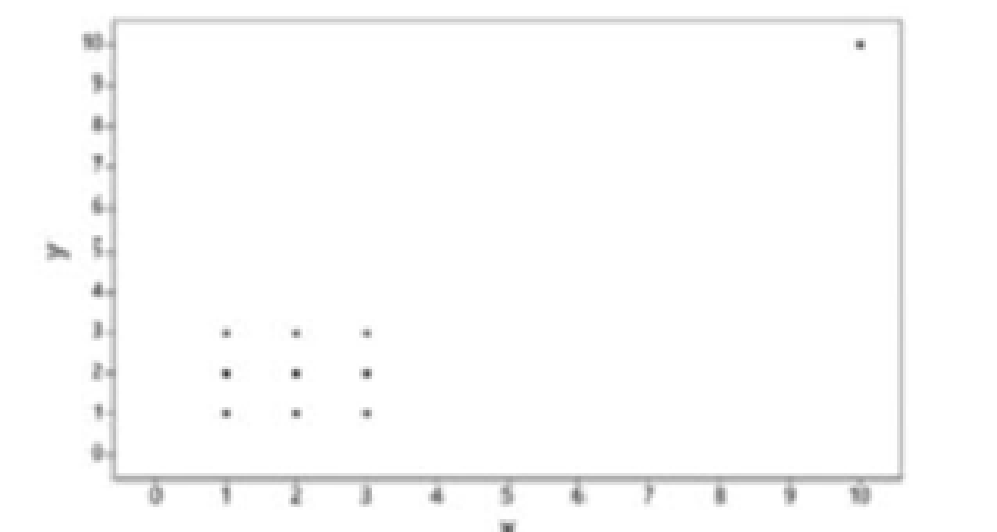
Outlier Refer in the accompanying Minitab-generated
- a. Examine the pattern of all 10 points and subjectively determine whether there appears to be a
correlation between x and y. - b. After identifying the 10 pairs of coordinates corresponding to the 10 points, find the value of the
correlation coefficient r and determine whether there is alinear correlation . - c. Now remove the point with coordinates (10, 10) and repeat parts (a) and (b).
- d. What do you conclude about the possible effect from a single pair of values?
Expert Solution & Answer
Want to see the full answer?
Check out a sample textbook solution
Students have asked these similar questions
Question 1:We want to evaluate the impact on the monetary economy for a company of two types of strategy (competitive strategy, cooperative strategy) adopted by buyers.Competitive strategy: strategy characterized by firm behavior aimed at obtaining concessions from the buyer.Cooperative strategy: a strategy based on a problem-solving negotiating attitude, with a high level of trust and cooperation.A random sample of 17 buyers took part in a negotiation experiment in which 9 buyers adopted the competitive strategy, and the other 8 the cooperative strategy. The savings obtained for each group of buyers are presented in the pdf that i sent:
For this problem, we assume that the samples are random and come from two normal populations of unknown but equal variances.According to the theory, the average saving of buyers adopting a competitive strategy will be lower than that of buyers adopting a cooperative strategy.a) Specify the population identifications and the hypotheses H0 and H1…
You assume that the annual incomes for certain workers are normal with a mean of $28,500 and a standard deviation of $2,400.
What’s the chance that a randomly selected employee makes more than $30,000?What’s the chance that 36 randomly selected employees make more than $30,000, on average?
What’s the chance that a fair coin comes up heads more than 60 times when you toss it 100 times?
Chapter 10 Solutions
Essentials of Statistics Books a la carte Plus NEW MyLab Statistics with Pearson eText - Access Card Package (5th Edition)
Ch. 10.2 - Notation For each of several randomly selected...Ch. 10.2 - Physics Experiment A physics experiment consists...Ch. 10.2 - Cause of High Blood Pressure Some studies have...Ch. 10.2 - Notation What is the difference between the...Ch. 10.2 - Interpreting r. In Exercises 5-8, use a...Ch. 10.2 - Interpreting r. In Exercises 5-8, use a...Ch. 10.2 - Interpreting r. In Exercises 5-8, use a...Ch. 10.2 - Cereal Killers The amounts of sugar (grams of...Ch. 10.2 - Explore! Exercises 9 and 10 provide two data sets...Ch. 10.2 - Explore! Exercises 9 and 10 provide two data sets...
Ch. 10.2 - Outlier Refer in the accompanying...Ch. 10.2 - Clusters Refer to the following Minitab-generated...Ch. 10.2 - Testing for a Linear Correlation. In Exercises...Ch. 10.2 - Prob. 14BSCCh. 10.2 - Testing for a Linear Correlation. In Exercises...Ch. 10.2 - Testing for a Linear Correlation. In Exercises...Ch. 10.2 - Testing for a Linear Correlation. In Exercises...Ch. 10.2 - Testing for a Linear Correlation. In Exercises...Ch. 10.2 - Prob. 19BSCCh. 10.2 - Prob. 20BSCCh. 10.2 - Testing for a Linear Correlation. In Exercises...Ch. 10.2 - Testing for a Linear Correlation. In Exercises...Ch. 10.2 - Prob. 23BSCCh. 10.2 - Prob. 24BSCCh. 10.2 - Testing for a Linear Correlation. In Exercises...Ch. 10.2 - Prob. 26BSCCh. 10.2 - Testing for a Linear Correlation. In Exercises...Ch. 10.2 - Testing for a Linear Correlation. In Exercises...Ch. 10.2 - Large Data Sets. In Exercises 29-32, use the data...Ch. 10.2 - Large Data Sets. In Exercises 29-32, use the data...Ch. 10.2 - Appendix B Data Sets. In Exercises 29-34, use the...Ch. 10.2 - Large Data Sets. In Exercises 29-32, use the data...Ch. 10.2 - Transformed Data In addition to testing for a...Ch. 10.2 - Prob. 34BBCh. 10.3 - Notation and Terminology If we use the paired...Ch. 10.3 - Best-Fit Line In what sense is the regression line...Ch. 10.3 - Prob. 3BSCCh. 10.3 - Notation What is the difference between the...Ch. 10.3 - Making Predictions. In Exercises 5-8, let the...Ch. 10.3 - Making Predictions. In Exercises 5-8, let the...Ch. 10.3 - Making Predictions. In Exercises 5-8, let the...Ch. 10.3 - Making Predictions. In Exercises 5-8, let the...Ch. 10.3 - Finding the Equation of the Regression Line. In...Ch. 10.3 - Finding the Equation of the Regression Line. In...Ch. 10.3 - Effects of an Outlier Refer to the Mini...Ch. 10.3 - Effects of Clusters Refer to the Minitab-generated...Ch. 10.3 - Regression and Predictions. Exercises 13-28 use...Ch. 10.3 - Regression and Predictions. Exercises 13-28 use...Ch. 10.3 - Regression and Predictions. Exercises 13-28 use...Ch. 10.3 - Regression and Predictions. Exercises 13-28 use...Ch. 10.3 - Regression and Predictions. Exercises 13-28 use...Ch. 10.3 - Regression and Predictions. Exercises 13-28 use...Ch. 10.3 - Regression and Predictions. Exercises 13-28 use...Ch. 10.3 - Regression and Predictions. Exercises 13-28 use...Ch. 10.3 - Regression and Predictions. Exercises 13-28 use...Ch. 10.3 - Regression and Predictions. Exercises 13-28 use...Ch. 10.3 - Regression and Predictions. Exercises 13-28 use...Ch. 10.3 - Regression and Predictions. Exercises 13-28 use...Ch. 10.3 - Regression and Predictions. Exercises 13-28 use...Ch. 10.3 - Regression and Predictions. Exercises 1328 use the...Ch. 10.3 - Regression and Predictions. Exercises 1328 use the...Ch. 10.3 - Regression and Predictions. Exercises 1328 use the...Ch. 10.3 - Large Data Sets. Exercises 2932 use the same...Ch. 10.3 - Large Data Sets. Exercises 2932 use the same...Ch. 10.3 - Prob. 31BSCCh. 10.3 - Large Data Sets. Exercises 29-32 use the same...Ch. 10.3 - Prob. 33BBCh. 10.3 - Prob. 34BBCh. 10.4 - Regression If the methods of this section arc used...Ch. 10.4 - Level of Measurement Which of the levels of...Ch. 10.4 - Prob. 3BSCCh. 10.4 - Prob. 4BSCCh. 10.4 - Prob. 5BSCCh. 10.4 - Prob. 6BSCCh. 10.4 - Prob. 7BSCCh. 10.4 - Testing for Rank Correlation. In Exercises 7-12,...Ch. 10.4 - Prob. 9BSCCh. 10.4 - Testing for Rank Correlation. In Exercises 7-12,...Ch. 10.4 - Prob. 11BSCCh. 10.4 - Prob. 12BSCCh. 10.4 - Appendix B Data Sets. In Exercises 13-16, use the...Ch. 10.4 - Prob. 14BSCCh. 10.4 - Appendix B Data Sets. In Exercises 13-16, use the...Ch. 10.4 - Prob. 16BSCCh. 10.4 - Prob. 17BBCh. 10 - The exercises arc based on the following sample...Ch. 10 - Prob. 2CQQCh. 10 - Prob. 3CQQCh. 10 - The exercises are based on the following sample...Ch. 10 - The exercises are based on the following sample...Ch. 10 - Prob. 6CQQCh. 10 - Prob. 7CQQCh. 10 - Prob. 8CQQCh. 10 - Prob. 9CQQCh. 10 - Prob. 10CQQCh. 10 - Old Faithful The table below lists measurements...Ch. 10 - Prob. 2RECh. 10 - Prob. 3RECh. 10 - Prob. 4RECh. 10 - Prob. 5RECh. 10 - Prob. 1CRECh. 10 - Prob. 2CRECh. 10 - Prob. 3CRECh. 10 - Prob. 4CRECh. 10 - Effectiveness of Diet. Listed below are weights...Ch. 10 - Prob. 6CRECh. 10 - Prob. 7CRECh. 10 - Effectiveness of Diet. Listed below are weights...Ch. 10 - Prob. 9CRECh. 10 - Prob. 10CRECh. 10 - Critical Thinking: Is replication validation? The...Ch. 10 - Prob. 2FDDCh. 10 - Prob. 3FDD
Knowledge Booster


Learn more about
Need a deep-dive on the concept behind this application? Look no further. Learn more about this topic, statistics and related others by exploring similar questions and additional content below.Similar questions
- Suppose that you have a normal population of quiz scores with mean 40 and standard deviation 10. Select a random sample of 40. What’s the chance that the mean of the quiz scores won’t exceed 45?Select one individual from the population. What’s the chance that his/her quiz score won’t exceed 45?arrow_forwardSuppose that you take a sample of 100 from a population that contains 45 percent Democrats. What sample size condition do you need to check here (if any)?What’s the standard error of ^P?Compare the standard errors of ^p n=100 for ,n=1000 , n=10,000, and comment.arrow_forwardSuppose that a class’s test scores have a mean of 80 and standard deviation of 5. You choose 25 students from the class. What’s the chance that the group’s average test score is more than 82?arrow_forward
- Suppose that you collect data on 10 products and check their weights. The average should be 10 ounces, but your sample mean is 9 ounces with standard deviation 2 ounces. Find the standard score.What percentile is the standard score found in part a of this question closest to?Suppose that the mean really is 10 ounces. Do you find these results unusual? Use probabilities to explain.arrow_forwardSuppose that you want to sample expensive computer chips, but you can have only n=3 of them. Should you continue the experiment?arrow_forwardSuppose that studies claim that 40 percent of cellphone owners use their phones in the car while driving. What’s the chance that more than 425 out of a random sample of 1,000 cellphone owners say they use their phones while driving?arrow_forward
- Suppose that the average length of stay in Europe for American tourists is 17 days, with standard deviation 4.5. You choose a random sample of 16 American tourists. The sample of 16 stay an average of 18.5 days or more. What’s the chance of that happening?arrow_forwardHow do you recognize that a statistical problem requires you to use the CLT? Think of one or two clues you can look for. (Assume quantitative data.)arrow_forwardSuppose that you take a sample of 100 from a skewed population with mean 50 and standard deviation 15. What sample size condition do you need to check here (if any)?What’s the shape and center of the sampling distribution for ?What’s the standard error?arrow_forward
- Question 3 The following stem-and-leaf displays the weekly salary of employees at this firm. Stem-and-Leaf Display Leaf Unit = 10.0 N=x 5 3 00123 12 4 0125888 (y) 5 11234456777 z 6 13568 5 7 154 2 8 46 i. Determine the value of x, y and z. [3] ii. What is the value of the median? [2] iii. Find the mode of this data set. iv. Calculate the range [1] [2]arrow_forwardLet Y be a continuous RV with PDF otherwise Find the CDF, Fry), of Y . Find an expression for pth, p € (0, 1), quantile of the distribution. Find E(Y) and V(Y). Find E(-2Y + 1) and V(-3Y - 2). Find E(Y3).arrow_forwardLet X be a continuous RV with CDF Find P(X < 0), P(-1 < X < 1) and P(0.5 < X). Based on your answers to the above questions, what is the median of the distribu-tion? Why Find the PDF, fx (x), of X.arrow_forward
arrow_back_ios
SEE MORE QUESTIONS
arrow_forward_ios
Recommended textbooks for you
 Big Ideas Math A Bridge To Success Algebra 1: Stu...AlgebraISBN:9781680331141Author:HOUGHTON MIFFLIN HARCOURTPublisher:Houghton Mifflin Harcourt
 Glencoe Algebra 1, Student Edition, 9780079039897...AlgebraISBN:9780079039897Author:CarterPublisher:McGraw Hill
 Holt Mcdougal Larson Pre-algebra: Student Edition...AlgebraISBN:9780547587776Author:HOLT MCDOUGALPublisher:HOLT MCDOUGAL
 Functions and Change: A Modeling Approach to Coll...AlgebraISBN:9781337111348Author:Bruce Crauder, Benny Evans, Alan NoellPublisher:Cengage Learning
 Trigonometry (MindTap Course List)TrigonometryISBN:9781337278461Author:Ron LarsonPublisher:Cengage Learning
Big Ideas Math A Bridge To Success Algebra 1: Stu...
Algebra
ISBN:9781680331141
Author:HOUGHTON MIFFLIN HARCOURT
Publisher:Houghton Mifflin Harcourt
Glencoe Algebra 1, Student Edition, 9780079039897...
Algebra
ISBN:9780079039897
Author:Carter
Publisher:McGraw Hill
Holt Mcdougal Larson Pre-algebra: Student Edition...
Algebra
ISBN:9780547587776
Author:HOLT MCDOUGAL
Publisher:HOLT MCDOUGAL
Functions and Change: A Modeling Approach to Coll...
Algebra
ISBN:9781337111348
Author:Bruce Crauder, Benny Evans, Alan Noell
Publisher:Cengage Learning
Trigonometry (MindTap Course List)
Trigonometry
ISBN:9781337278461
Author:Ron Larson
Publisher:Cengage Learning
Correlation Vs Regression: Difference Between them with definition & Comparison Chart; Author: Key Differences;https://www.youtube.com/watch?v=Ou2QGSJVd0U;License: Standard YouTube License, CC-BY
Correlation and Regression: Concepts with Illustrative examples; Author: LEARN & APPLY : Lean and Six Sigma;https://www.youtube.com/watch?v=xTpHD5WLuoA;License: Standard YouTube License, CC-BY