
EP FINITE MATH.F/BUS,ECON,LIFE..-ACCESS
14th Edition
ISBN: 9780135988244
Author: Barnett
Publisher: PEARSON CO
expand_more
expand_more
format_list_bulleted
Videos
Textbook Question
Chapter 10.1, Problem 6E
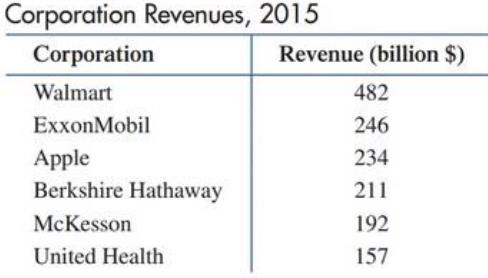
Corporation revenues. Graph the data in the following table using a bar graph.
Expert Solution & Answer
Want to see the full answer?
Check out a sample textbook solution
Students have asked these similar questions
3) Recall that the power set of a set A is the set of all subsets of A: PA = {S: SC A}.
Prove the following proposition.
АСВ РАСРВ
A sequence X = (xn) is said to be a contractive sequence if there is a constant 0 < C < 1 so
that
for all n = N.
-
|Xn+1 − xn| ≤ C|Xn — Xn−1|
-
3) Find the surface area of z
-1≤ y ≤1
=
1 + x + y + x2 over the rectangle −2 ≤ x ≤ 1 and
-
Solution: TYPE YOUR SOLUTION HERE! ALSO: Generate a plot of the surface
in Mathematica and include that plot in your solution!
Chapter 10 Solutions
EP FINITE MATH.F/BUS,ECON,LIFE..-ACCESS
Ch. 10.1 - (A) Using Figure 3, estimate the median annual...Ch. 10.1 - (A) Using Figure 6 estimate the revenue and costs...Ch. 10.1 - Repeat Example 1 for the following intervals: (A)...Ch. 10.1 - The weights (in pounds) were recorded for 20...Ch. 10.1 - (A) Construct a frequency table and histogram for...Ch. 10.1 - (A) Construct a frequency table and histogram for...Ch. 10.1 - Gross domestic product. Graph the data in the...Ch. 10.1 - Corporation revenues. Graph the data in the...Ch. 10.1 - Gold production. Use the double bar graph on world...Ch. 10.1 - Gasoline prices .Graph the data in the following...
Ch. 10.1 - Postal service. Graph the data in the following...Ch. 10.1 - Postal service. Refer to Problem 9. If the data...Ch. 10.1 - Federal income. Graph the data in the following...Ch. 10.1 - Gasoline prices. In April 2017 the average price...Ch. 10.1 - Starting salaries. The starting salaries (in...Ch. 10.1 - Commute times. Thirty-two people were chosen at...Ch. 10.1 - Common stocks. The following table shows...Ch. 10.1 - Mouse weights. One hundred healthy mice were...Ch. 10.1 - Population growth. Graph the data in the following...Ch. 10.1 - Aims epidemic. One way to gauge the toll of the...Ch. 10.1 - Nutrition. Graph the data in the following table...Ch. 10.1 - Greenhouse gases. The U.S. Environmental...Ch. 10.1 - Nutrition. Graph the nutritional information in...Ch. 10.1 - Nutrition. Refer to Problem 21. Suppose that you...Ch. 10.1 - Education. For statistical studies, U.S. states...Ch. 10.1 - Study abroad. Would a pie graph be more effective...Ch. 10.1 - Median age. Use the broken-line graph shown to...Ch. 10.1 - State prisoners. In 1980 in the United States, 6...Ch. 10.1 - Grade point Averages. One hundred seniors were...Ch. 10.2 - For many sets of measurements the median lies...Ch. 10.2 - Find the mean for the sample measurements...Ch. 10.2 - Compute the mean for the grouped sample data...Ch. 10.2 - Add the salary $100,000 to those in Example 3 and...Ch. 10.2 - Find the median for the grouped data in the...Ch. 10.2 - Compute the mode(s), median, and mean for each...Ch. 10.2 - In Problems 1-4, find the mean of the data set....Ch. 10.2 - In Problems 1-4, find the mean of the data set....Ch. 10.2 - In Problems 1-4, find the mean of the data set....Ch. 10.2 - In Problems 1-4, find the mean of the data set....Ch. 10.2 - In Problems 5-8, find the indicated sum. (If...Ch. 10.2 - In Problems 5-8, find the indicated sum. (If...Ch. 10.2 - In Problems 5-8, find the indicated sum. (If...Ch. 10.2 - In Problems 5-8, find the indicated sum. (If...Ch. 10.2 - Find the mean, median, and mode for the sets of...Ch. 10.2 - Find the mean, median, and mode for the sets of...Ch. 10.2 - Find the mean, median, and/or mode, whichever are...Ch. 10.2 - Find the mean, median, and/or mode, whichever are...Ch. 10.2 - Find the mean for the sets of grouped data in...Ch. 10.2 - Find the mean for the sets of grouped data in...Ch. 10.2 - Which single measure of central tendency-mean,...Ch. 10.2 - Which single measure of central tendency mean,...Ch. 10.2 - A data set is formed by recording the results of...Ch. 10.2 - A data set is formed by recording the sums on 200...Ch. 10.2 - (A) Construct a set of four numbers that has mean...Ch. 10.2 - (A) Construct a set of five numbers that has mean...Ch. 10.2 - Price earnings ratios. Find the mean, median, and...Ch. 10.2 - Gasoline tax. Find the mean, median, and mode for...Ch. 10.2 - Light bulb lifetime. Find the mean and median for...Ch. 10.2 - Price earnings ratios. Find the mean and median...Ch. 10.2 - Student loan debt. Find the mean median, and mode...Ch. 10.2 - Tourism Find the mean, median, and mode for the...Ch. 10.2 - Mouse weights. Find the mean and median for the...Ch. 10.2 - Blood cholesterol levels. Find the mean and median...Ch. 10.2 - Immigration Find the mean, median, and mode for...Ch. 10.2 - Grade point averages. Find the mean and median for...Ch. 10.2 - Entrance examination scores. Compute the median...Ch. 10.2 - Presidents. Find the mean and median for the...Ch. 10.3 - (A) When is the sample standard deviation of a set...Ch. 10.3 - Find the standard deviation for the sample...Ch. 10.3 - Find the standard deviation for the grouped sample...Ch. 10.3 - Prob. 1ECh. 10.3 - In Problems 1-8, find the indicated sum. (If...Ch. 10.3 - In Problems 1-8, find the indicated sum. (If...Ch. 10.3 - In Problems 1-8, find the indicated sum. (If...Ch. 10.3 - In Problems 1-8, find the indicated sum. (If...Ch. 10.3 - In Problems 1-8, find the indicated sum. (If...Ch. 10.3 - In Problems 1-8, find the indicated sum. (If...Ch. 10.3 - In Problems 1-8, find the indicated sum. (If...Ch. 10.3 - (A) Find set of the ungrouped mean and sample...Ch. 10.3 - (A) Find the mean and standard deviation of the...Ch. 10.3 - In Problems 11 and 12, find the standard deviation...Ch. 10.3 - In Problems 11 and 12, find the standard deviation...Ch. 10.3 - In Problems 13-18, discuss the validity of each...Ch. 10.3 - In Problems 13-18, discuss the validity of each...Ch. 10.3 - In Problems 13-18, discuss the validity of each...Ch. 10.3 - In Problems 13-18, discuss the validity of each...Ch. 10.3 - In Problems 13-18, discuss the validity of each...Ch. 10.3 - In Problems 13-18, discuss the validity of each...Ch. 10.3 - A data set is formed by recording the sums in 100...Ch. 10.3 - A data set is formed by recording the results of...Ch. 10.3 - Find the mean and standard deviation for each of...Ch. 10.3 - Find the mean and standard deviation for each of...Ch. 10.3 - Find the mean and standard deviation for each of...Ch. 10.3 - Find the mean and standard deviation for each of...Ch. 10.3 - Find the mean and standard deviation for each of...Ch. 10.3 - Find the mean and standard deviation for each of...Ch. 10.3 - Find the mean and standard deviation for each of...Ch. 10.3 - Find the mean and standard deviation for each of...Ch. 10.4 - Find p and q for a single roll of a fair die,...Ch. 10.4 - In Example 2, find the probability of the outcome...Ch. 10.4 - Using the same die experiment as in Example 3,...Ch. 10.4 - Use the binomial formula to expand q+p4.Ch. 10.4 - Repeat Example 5, where the binomial experiment...Ch. 10.4 - Compute the mean and standard deviation for the...Ch. 10.4 - Repeat Example 7 for four patients. The...Ch. 10.4 - Evaluate nCxpxqnx for the values of n,x, and p...Ch. 10.4 - Evaluate nCxpxqnx for the values of n,x, and p...Ch. 10.4 - Evaluate nCxpxqnx for the values of n,x, and p...Ch. 10.4 - Evaluate nCxpxqnx for the values of n,x, and p...Ch. 10.4 - Evaluate nCxpxqnx for the values of n,x, and p...Ch. 10.4 - Evaluate nCxpxqnx for the values of n,x, and p...Ch. 10.4 - In Problems 7-12, a fair coin is tossed four...Ch. 10.4 - In Problems 7-12, a fair coin is tossed four...Ch. 10.4 - In Problems 7-12, a fair coin is tossed four...Ch. 10.4 - In Problems 7-12, a fair coin is tossed four...Ch. 10.4 - In Problems 7-12, a fair coin is tossed four...Ch. 10.4 - In Problems 7-12, a fair coin is tossed four...Ch. 10.4 - In Problems 13-18 construct a histogram for the...Ch. 10.4 - In Problems 13-18 construct a histogram for the...Ch. 10.4 - In Problems 13-18 construct a histogram for the...Ch. 10.4 - In Problems 13-18 construct a histogram for the...Ch. 10.4 - In Problems 13-18 construct a histogram for the...Ch. 10.4 - In Problems 13-18 construct a histogram for the...Ch. 10.4 - In Problems 19-24, round answers to four decimal...Ch. 10.4 - In Problems 19-24, round answers to four decimal...Ch. 10.4 - In Problems 19-24, round answers to four decimal...Ch. 10.4 - In Problems 19-24, round answers to four decimal...Ch. 10.4 - In Problems 19-24, round answers to four decimal...Ch. 10.4 - In Problems 19-24, round answers to four decimal...Ch. 10.4 - If a baseball player has a batting average of 350...Ch. 10.4 - If a true-false test with 10 questions is given,...Ch. 10.4 - A multiple-choice test consists of 10 questions,...Ch. 10.4 - If 60 of the electorate supports the mayor, what...Ch. 10.4 - Construct a histogram for each of the binomial...Ch. 10.4 - Construct a histogram for each of the binomial...Ch. 10.4 - Construct a histogram for each of the binomial...Ch. 10.4 - Construct a histogram for each of the binomial...Ch. 10.4 - A random variable represents the number of...Ch. 10.4 - A random variable represents the number of...Ch. 10.4 - In Problems 35 and 36 a coin is loaded so that the...Ch. 10.4 - In Problems 35 and 36 a coin is loaded so that the...Ch. 10.4 - Find conditions on p that guarantee the histogram...Ch. 10.4 - Consider two binomial distributions for 1,000...Ch. 10.4 - A random variable represents the number of heads...Ch. 10.4 - A random variable represents the number of times a...Ch. 10.4 - Management training each year a company selects a...Ch. 10.4 - Employee turnover. If the probability of a new...Ch. 10.4 - Quality control A manufacturing process produces,...Ch. 10.4 - Guarantees. A manufacturing process produces, on...Ch. 10.4 - Quality control. A manufacturing process produces,...Ch. 10.4 - Management training. Each year a company selects 5...Ch. 10.4 - Medical diagnosis A tuberculosis patient is given...Ch. 10.4 - Harmful drug side effect. A pharmaceutical...Ch. 10.4 - Genetics. The probability that brown-eyed parents,...Ch. 10.4 - Gene mutation the probability of gene mutation...Ch. 10.4 - Epidemics. If the probability of a person...Ch. 10.4 - Drug side effect the probability that a given drug...Ch. 10.4 - Testing A multiple-choice test is given with 5...Ch. 10.4 - Opinion polls. An opinion poll based on a small...Ch. 10.4 - Testing. A multiple-choice test is given with 5...Ch. 10.4 - Sociology. The probability that a marriage will...Ch. 10.4 - Sociology. If the probability is .55 that a...Ch. 10.5 - What percentage of the light bulbs in Example 1...Ch. 10.5 - Refer to Example 1. What is the probability that a...Ch. 10.5 - In Example 3, Use the normal curve to approximate...Ch. 10.5 - Suppose in Example 4 that the manufacturing...Ch. 10.5 - In Problems 1-6, use Appendix C to find the area...Ch. 10.5 - In Problems 1-6, use Appendix C to find the area...Ch. 10.5 - In Problems 1-6, use Appendix C to find the area...Ch. 10.5 - In Problems 1-6, use Appendix C to find the area...Ch. 10.5 - In Problems 1-6, use Appendix C to find the area...Ch. 10.5 - In Problems 1-6, use Appendix C to find the area...Ch. 10.5 - In Problems 7-14, use Appendix C to find the area...Ch. 10.5 - In Problems 7-14, use Appendix C to find the area...Ch. 10.5 - In Problems 7-14, use Appendix C to find the area...Ch. 10.5 - Prob. 10ECh. 10.5 - In Problems 7-14, use Appendix C to find the area...Ch. 10.5 - In Problems 7-14, use Appendix C to find the area...Ch. 10.5 - In Problems 7-14, use Appendix C to find the area...Ch. 10.5 - In Problems 7-14, use Appendix C to find the area...Ch. 10.5 - In Problems 15-20, given a normal distribution...Ch. 10.5 - In Problems 15-20, given a normal distribution...Ch. 10.5 - In Problems 15-20, given a normal distribution...Ch. 10.5 - In Problems 15-20, given a normal distribution...Ch. 10.5 - In Problems 15-20, given a normal distribution...Ch. 10.5 - In Problems 15-20, given a normal distribution...Ch. 10.5 - In Problems 21.26, given a normal distribution...Ch. 10.5 - In Problems 21.26, given a normal distribution...Ch. 10.5 - In Problems 21.26, given a normal distribution...Ch. 10.5 - In Problems 21.26, given a normal distribution...Ch. 10.5 - In Problems 21.26, given a normal distribution...Ch. 10.5 - In Problems 21.26, given a normal distribution...Ch. 10.5 - In Problems 27-34, consider the normal...Ch. 10.5 - In Problems 27-34, consider the normal...Ch. 10.5 - Consider the normal distribution with mean 60 and...Ch. 10.5 - In Problems 27-34, consider the normal...Ch. 10.5 - In Problems 27-34, consider the normal...Ch. 10.5 - In Problems 27-34, consider the normal...Ch. 10.5 - In Problems 27-34, consider the normal...Ch. 10.5 - In Problems 27-34, consider the normal...Ch. 10.5 - In Problems 35-40, discuss the validity of each...Ch. 10.5 - In Problems 35-40, discuss the validity of each...Ch. 10.5 - In Problems 35-40, discuss the validity of each...Ch. 10.5 - In Problems 35-40, discuss the validity of each...Ch. 10.5 - In Problems 35-40, discuss the validity of each...Ch. 10.5 - In Problems 35-40, discuss the validity of each...Ch. 10.5 - In Problems 41-48, use the rule-of-thumb test to...Ch. 10.5 - In Problems 41-48, use the rule-of-thumb test to...Ch. 10.5 - In Problems 41-48, use the rule-of-thumb test to...Ch. 10.5 - In Problems 41-48, use the rule-of-thumb test to...Ch. 10.5 - In Problems 41-48, use the rule-of-thumb test to...Ch. 10.5 - In Problems 41-48, use the rule-of-thumb test to...Ch. 10.5 - In Problems 41-48, use the rule-of-thumb test to...Ch. 10.5 - In Problems 41-48, use the rule-of-thumb test to...Ch. 10.5 - The probability of success in a Bernoulli trial is...Ch. 10.5 - For a binomial distribution with n=100, explain...Ch. 10.5 - A binomial experiment consists of 500 trials. The...Ch. 10.5 - A binomial experiment consists of 500 trials. The...Ch. 10.5 - A binomial experiment consists of 500 trials. The...Ch. 10.5 - A binomial experiment consists of 500 trials. The...Ch. 10.5 - A binomial experiment consists of 500 trials. The...Ch. 10.5 - A binomial experiment consists of 500 trials. The...Ch. 10.5 - A binomial experiment consists of 500 trials. The...Ch. 10.5 - A binomial experiment consists of 500 trials. The...Ch. 10.5 - To graph Problems 59-62, use a graphing calculator...Ch. 10.5 - To graph Problems 59-62, use a graphing calculator...Ch. 10.5 - To graph Problems 59-62, use a graphing calculator...Ch. 10.5 - To graph Problems 59-62, use a graphing calculator...Ch. 10.5 - (A) If 120 scores are chosen from a normal...Ch. 10.5 - (A) If 250 scores are chosen from a normal...Ch. 10.5 - Sales Salespeople for a solar technology company...Ch. 10.5 - Guarantees. The average lifetime for a car battery...Ch. 10.5 - Quality control. A manufacturing process produces...Ch. 10.5 - Quality control. An automated manufacturing...Ch. 10.5 - Marketing claims. A company claims that 60 of the...Ch. 10.5 - Labor relation A union representative 60 claims of...Ch. 10.5 - Medicine. The average healing time of a certain...Ch. 10.5 - Agriculture. The average height of a hay crop is...Ch. 10.5 - Genetics. In a family with 2 children, the...Ch. 10.5 - Genetics. In Problem 73, what is the approximate...Ch. 10.5 - Testing. Scholastic Aptitude Tests (SATs) are...Ch. 10.5 - Politics. Candidate Harkins claims that she will...Ch. 10.5 - Grading on a curve. An instructor grades on a...Ch. 10.5 - Psychology. A test devised to measure...Ch. 10 - Use a bar graph and a broken-line graph to graph...Ch. 10 - Use a pie graph to graph the data on educational...Ch. 10 - (A) Draw a histogram for the binomial distribution...Ch. 10 - For the set of sample measurements...Ch. 10 - If a normal distribution has a mean of 100 and a...Ch. 10 - Given the sample of 25 quiz scores listed in the...Ch. 10 - For the set of grouped sample data given in the...Ch. 10 - (A) Construct a histogram for the binomial...Ch. 10 - What are the mean and standard deviation for a...Ch. 10 - In Problems 10 and 11, discuss the validity of...Ch. 10 - In Problems 10 and 11, discuss the validity of...Ch. 10 - If the probability of success in a single trial of...Ch. 10 - Given a normal distribution with mean 50 and...Ch. 10 - A data set is formed by recording the sums of 100...Ch. 10 - For the sample quiz scores in Problem 6, find the...Ch. 10 - A fair die is rolled five times. What is the...Ch. 10 - Two dice are rolled three times. What is the...Ch. 10 - Ten students take an exam worth 100 points. (A)...Ch. 10 - In the last presidential election, 39 of a city’s...Ch. 10 - A random variable represents the number of wins in...Ch. 10 - Retail sales. The daily number of bad checks...Ch. 10 - Preference survey. Find the mean, median, and/or...Ch. 10 - Plant safety. The weekly record of reported...Ch. 10 - Personnel screening.The scores on a screening test...Ch. 10 - Market research A newspaper publisher claims that...Ch. 10 - Health care. A small town has three doctors on...
Additional Math Textbook Solutions
Find more solutions based on key concepts
A categorical variable has three categories, with the following frequencies of occurrence: a. Compute the perce...
Basic Business Statistics, Student Value Edition
Coke versus Pepsi (Example 5) Suppose you are testing someone to see whether she or he can tell Coke from Pepsi...
Introductory Statistics
76. Dew Point and Altitude The dew point decreases as altitude increases. If the dew point on the ground is 80°...
College Algebra with Modeling & Visualization (5th Edition)
Fill in each blank so that the resulting statement is true. Any set of ordered pairs is called a/an ____.The se...
Algebra and Trigonometry (6th Edition)
To solve the equation, then check your solution and graph it on number line
Pre-Algebra Student Edition
The equivalent expression of x(y+z) by using the commutative property.
Calculus for Business, Economics, Life Sciences, and Social Sciences (14th Edition)
Knowledge Booster


Learn more about
Need a deep-dive on the concept behind this application? Look no further. Learn more about this topic, subject and related others by exploring similar questions and additional content below.Similar questions
- 7. Walkabout. Does this graph have an Euler circuit? If so, find one. If not, explain why not.arrow_forwardBelow, let A, B, and C be sets. 1) Prove (AUB) nC = (ANC) U (BNC).arrow_forwardQ1: find the Reliability of component in the system in fig(1) by minimal cut method. Q2: A component A with constant failure rate 1.5 per 1000 h, B per to 2 in 1000h, A and B in parallel, find the Reliability system? [ by exponential distribution]. Q3: Give an example to find the minimal path and estimate the reliability of this block diagram. Q4: By Tie set method find the Reliability of fig (2) FUZarrow_forward
- A sequence X = (xn) is said to be a contractive sequence if there is a constant 0 < C < 1 so that for all n = N. - |Xn+1 − xn| ≤ C|Xn — Xn−1| -arrow_forward1) Suppose continuous random variable X has sample space S = [1, ∞) and a pdf of the form f(x) = Ce-(2-1)/2. What is the expected value of X?arrow_forwardA sequence X = (xn) is said to be a contractive sequence if there is a constant 0 < C < 1 so that for all n = N. - |Xn+1 − xn| ≤ C|Xn — Xn−1| -arrow_forward
- 1) Find the equation of the tangent line to the graph y=xe at the point (1, 1).arrow_forward3) Suppose that f is differentiable on [0, 5], and f'(x) ≤ 3 over this interval. If f(0) = −1, what is the maximum possible value of f(5)?arrow_forward2) Find the general solution to the differential equation d²x dt² 2 dax = dtarrow_forward
- 2) Prove (AB) UC = (AUC)n (BUC).arrow_forward2) Find the maximum value of f(x, y) = x - y on the circle x² + y² - 4x - 2y - 4 = 0.arrow_forwardBlue Ridge Hot Tubs manufactures and sells two models of hot tubs: the Aqua-Spa and the Hydro-Lux. Howie Jones, the owner and manager of the company, needs to decide how many of each type of hot tub to produce during his next production cycle. Howie buys prefabricated fiberglass hot tub shells from a local supplier and adds the pump and tubing to the shells to create his hot tubs. (This supplier has the capacity to deliver as many hot tub shells as Howie needs.) Howie installs the same type of pump into both hot tubs. He will have only 200 pumps available during his next production cycle. From a manufacturing standpoint, the main difference between the two models of hot tubs is the amount of tubing and labor required. Each Aqua-Spa requires 9 hours of labor and 12 feet of tubing. Each Hydro-Lux requires 6 hours of labor and 16 feet of tubing. Howie expects to have 1,566 production labor hours and 2,880 feet of tubing available during the next production cycle. Howie earns a profit of…arrow_forward
arrow_back_ios
SEE MORE QUESTIONS
arrow_forward_ios
Recommended textbooks for you
 Glencoe Algebra 1, Student Edition, 9780079039897...AlgebraISBN:9780079039897Author:CarterPublisher:McGraw Hill
 Holt Mcdougal Larson Pre-algebra: Student Edition...AlgebraISBN:9780547587776Author:HOLT MCDOUGALPublisher:HOLT MCDOUGAL
 Big Ideas Math A Bridge To Success Algebra 1: Stu...AlgebraISBN:9781680331141Author:HOUGHTON MIFFLIN HARCOURTPublisher:Houghton Mifflin Harcourt
 Functions and Change: A Modeling Approach to Coll...AlgebraISBN:9781337111348Author:Bruce Crauder, Benny Evans, Alan NoellPublisher:Cengage Learning
 Algebra: Structure And Method, Book 1AlgebraISBN:9780395977224Author:Richard G. Brown, Mary P. Dolciani, Robert H. Sorgenfrey, William L. ColePublisher:McDougal Littell
Glencoe Algebra 1, Student Edition, 9780079039897...
Algebra
ISBN:9780079039897
Author:Carter
Publisher:McGraw Hill
Holt Mcdougal Larson Pre-algebra: Student Edition...
Algebra
ISBN:9780547587776
Author:HOLT MCDOUGAL
Publisher:HOLT MCDOUGAL
Big Ideas Math A Bridge To Success Algebra 1: Stu...
Algebra
ISBN:9781680331141
Author:HOUGHTON MIFFLIN HARCOURT
Publisher:Houghton Mifflin Harcourt
Functions and Change: A Modeling Approach to Coll...
Algebra
ISBN:9781337111348
Author:Bruce Crauder, Benny Evans, Alan Noell
Publisher:Cengage Learning
Algebra: Structure And Method, Book 1
Algebra
ISBN:9780395977224
Author:Richard G. Brown, Mary P. Dolciani, Robert H. Sorgenfrey, William L. Cole
Publisher:McDougal Littell
How to make Frequency Distribution Table / Tally Marks and Frequency Distribution Table; Author: Reenu Math;https://www.youtube.com/watch?v=i_A6RiE8tLE;License: Standard YouTube License, CC-BY
Frequency distribution table in statistics; Author: Math and Science;https://www.youtube.com/watch?v=T7KYO76DoOE;License: Standard YouTube License, CC-BY
Frequency Distribution Table for Grouped/Continuous data | Math Dot Com; Author: Maths dotcom;https://www.youtube.com/watch?v=ErnccbXQOPY;License: Standard Youtube License