
Finite Mathematics for Business, Economics, Life Sciences and Social Sciences
14th Edition
ISBN: 9780134677972
Author: Barnett
Publisher: PEARSON
expand_more
expand_more
format_list_bulleted
Videos
Textbook Question
Chapter 10.1, Problem 24E
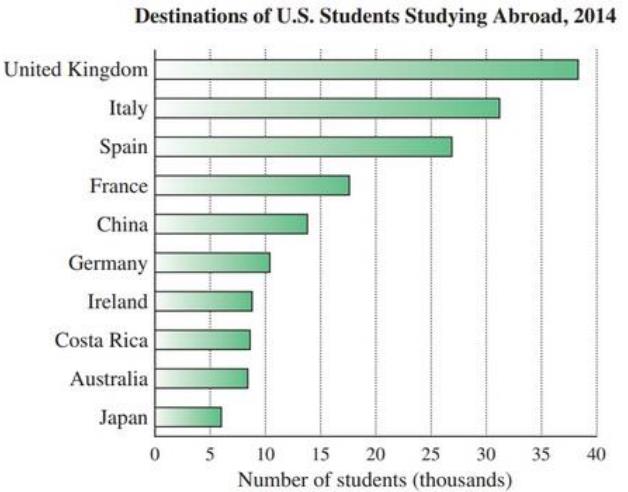
Study abroad. Would a pie graph be more effective or less effective than the bar graph shown in presenting information on the most popular destinations of U.S. college students who study abroad? Justify your answer.
Expert Solution & Answer
Want to see the full answer?
Check out a sample textbook solution
Students have asked these similar questions
3. Verify that the indicated function (or family of functions) is a solution of the given differential equation. Assume an
appropriate interval I of definition for each solution.
The average number of minutes Americans commute to work is 27.7 minutes (Sterling's Best Places, April 13, 2012). The average commute time in minutes for 48 cities are as follows:
Click on the datafile logo to reference the data.
DATA file
Albuquerque
23.3
Jacksonville
26.2
Phoenix
28.3
Atlanta
28.3
Kansas City
23.4
Pittsburgh
25.0
Austin
24.6
Las Vegas
28.4
Portland
26.4
Baltimore
32.1
Little Rock
20.1
Providence
23.6
Boston
31.7
Los Angeles
32.2
Richmond
23.4
Charlotte
25.8
Louisville
21.4
Sacramento
25.8
Chicago
38.1
Memphis
23.8
Salt Lake City
20.2
Cincinnati
24.9
Miami
30.7
San Antonio
26.1
Cleveland
26.8
Milwaukee
24.8
San Diego
24.8
Columbus
23.4
Minneapolis
23.6
San Francisco
32.6
Dallas
28.5
Nashville
25.3
San Jose
28.5
Denver
28.1
New Orleans
31.7
Seattle
27.3
Detroit
29.3
New York
43.8
St. Louis
26.8
El Paso
24.4
Oklahoma City
22.0
Tucson
24.0
Fresno
23.0
Orlando
27.1
Tulsa
20.1
Indianapolis
24.8
Philadelphia
34.2
Washington, D.C.
32.8
a. What is the mean commute time for…
(b)
313
dy
dx
-y= 10 sin(2x)y;
y(x) = ex-5 cos(2x)
Chapter 10 Solutions
Finite Mathematics for Business, Economics, Life Sciences and Social Sciences
Ch. 10.1 - (A) Using Figure 3, estimate the median annual...Ch. 10.1 - (A) Using Figure 6 estimate the revenue and costs...Ch. 10.1 - Repeat Example 1 for the following intervals: (A)...Ch. 10.1 - The weights (in pounds) were recorded for 20...Ch. 10.1 - (A) Construct a frequency table and histogram for...Ch. 10.1 - (A) Construct a frequency table and histogram for...Ch. 10.1 - Gross domestic product. Graph the data in the...Ch. 10.1 - Corporation revenues. Graph the data in the...Ch. 10.1 - Gold production. Use the double bar graph on world...Ch. 10.1 - Gasoline prices .Graph the data in the following...
Ch. 10.1 - Postal service. Graph the data in the following...Ch. 10.1 - Postal service. Refer to Problem 9. If the data...Ch. 10.1 - Federal income. Graph the data in the following...Ch. 10.1 - Gasoline prices. In April 2017 the average price...Ch. 10.1 - Starting salaries. The starting salaries (in...Ch. 10.1 - Commute times. Thirty-two people were chosen at...Ch. 10.1 - Common stocks. The following table shows...Ch. 10.1 - Mouse weights. One hundred healthy mice were...Ch. 10.1 - Population growth. Graph the data in the following...Ch. 10.1 - Aims epidemic. One way to gauge the toll of the...Ch. 10.1 - Nutrition. Graph the data in the following table...Ch. 10.1 - Greenhouse gases. The U.S. Environmental...Ch. 10.1 - Nutrition. Graph the nutritional information in...Ch. 10.1 - Nutrition. Refer to Problem 21. Suppose that you...Ch. 10.1 - Education. For statistical studies, U.S. states...Ch. 10.1 - Study abroad. Would a pie graph be more effective...Ch. 10.1 - Median age. Use the broken-line graph shown to...Ch. 10.1 - State prisoners. In 1980 in the United States, 6...Ch. 10.1 - Grade point Averages. One hundred seniors were...Ch. 10.2 - For many sets of measurements the median lies...Ch. 10.2 - Find the mean for the sample measurements...Ch. 10.2 - Compute the mean for the grouped sample data...Ch. 10.2 - Add the salary $100,000 to those in Example 3 and...Ch. 10.2 - Find the median for the grouped data in the...Ch. 10.2 - Compute the mode(s), median, and mean for each...Ch. 10.2 - In Problems 1-4, find the mean of the data set....Ch. 10.2 - In Problems 1-4, find the mean of the data set....Ch. 10.2 - In Problems 1-4, find the mean of the data set....Ch. 10.2 - In Problems 1-4, find the mean of the data set....Ch. 10.2 - In Problems 5-8, find the indicated sum. (If...Ch. 10.2 - In Problems 5-8, find the indicated sum. (If...Ch. 10.2 - In Problems 5-8, find the indicated sum. (If...Ch. 10.2 - In Problems 5-8, find the indicated sum. (If...Ch. 10.2 - Find the mean, median, and mode for the sets of...Ch. 10.2 - Find the mean, median, and mode for the sets of...Ch. 10.2 - Find the mean, median, and/or mode, whichever are...Ch. 10.2 - Find the mean, median, and/or mode, whichever are...Ch. 10.2 - Find the mean for the sets of grouped data in...Ch. 10.2 - Find the mean for the sets of grouped data in...Ch. 10.2 - Which single measure of central tendency-mean,...Ch. 10.2 - Which single measure of central tendency mean,...Ch. 10.2 - A data set is formed by recording the results of...Ch. 10.2 - A data set is formed by recording the sums on 200...Ch. 10.2 - (A) Construct a set of four numbers that has mean...Ch. 10.2 - (A) Construct a set of five numbers that has mean...Ch. 10.2 - Price earnings ratios. Find the mean, median, and...Ch. 10.2 - Gasoline tax. Find the mean, median, and mode for...Ch. 10.2 - Light bulb lifetime. Find the mean and median for...Ch. 10.2 - Price earnings ratios. Find the mean and median...Ch. 10.2 - Student loan debt. Find the mean median, and mode...Ch. 10.2 - Tourism Find the mean, median, and mode for the...Ch. 10.2 - Mouse weights. Find the mean and median for the...Ch. 10.2 - Blood cholesterol levels. Find the mean and median...Ch. 10.2 - Immigration Find the mean, median, and mode for...Ch. 10.2 - Grade point averages. Find the mean and median for...Ch. 10.2 - Entrance examination scores. Compute the median...Ch. 10.2 - Presidents. Find the mean and median for the...Ch. 10.3 - (A) When is the sample standard deviation of a set...Ch. 10.3 - Find the standard deviation for the sample...Ch. 10.3 - Find the standard deviation for the grouped sample...Ch. 10.3 - Prob. 1ECh. 10.3 - In Problems 1-8, find the indicated sum. (If...Ch. 10.3 - In Problems 1-8, find the indicated sum. (If...Ch. 10.3 - In Problems 1-8, find the indicated sum. (If...Ch. 10.3 - In Problems 1-8, find the indicated sum. (If...Ch. 10.3 - In Problems 1-8, find the indicated sum. (If...Ch. 10.3 - In Problems 1-8, find the indicated sum. (If...Ch. 10.3 - In Problems 1-8, find the indicated sum. (If...Ch. 10.3 - (A) Find set of the ungrouped mean and sample...Ch. 10.3 - (A) Find the mean and standard deviation of the...Ch. 10.3 - In Problems 11 and 12, find the standard deviation...Ch. 10.3 - In Problems 11 and 12, find the standard deviation...Ch. 10.3 - In Problems 13-18, discuss the validity of each...Ch. 10.3 - In Problems 13-18, discuss the validity of each...Ch. 10.3 - In Problems 13-18, discuss the validity of each...Ch. 10.3 - In Problems 13-18, discuss the validity of each...Ch. 10.3 - In Problems 13-18, discuss the validity of each...Ch. 10.3 - In Problems 13-18, discuss the validity of each...Ch. 10.3 - A data set is formed by recording the sums in 100...Ch. 10.3 - A data set is formed by recording the results of...Ch. 10.3 - Find the mean and standard deviation for each of...Ch. 10.3 - Find the mean and standard deviation for each of...Ch. 10.3 - Find the mean and standard deviation for each of...Ch. 10.3 - Find the mean and standard deviation for each of...Ch. 10.3 - Find the mean and standard deviation for each of...Ch. 10.3 - Find the mean and standard deviation for each of...Ch. 10.3 - Find the mean and standard deviation for each of...Ch. 10.3 - Find the mean and standard deviation for each of...Ch. 10.4 - Find p and q for a single roll of a fair die,...Ch. 10.4 - In Example 2, find the probability of the outcome...Ch. 10.4 - Using the same die experiment as in Example 3,...Ch. 10.4 - Use the binomial formula to expand q+p4.Ch. 10.4 - Repeat Example 5, where the binomial experiment...Ch. 10.4 - Compute the mean and standard deviation for the...Ch. 10.4 - Repeat Example 7 for four patients. The...Ch. 10.4 - Evaluate nCxpxqnx for the values of n,x, and p...Ch. 10.4 - Evaluate nCxpxqnx for the values of n,x, and p...Ch. 10.4 - Evaluate nCxpxqnx for the values of n,x, and p...Ch. 10.4 - Evaluate nCxpxqnx for the values of n,x, and p...Ch. 10.4 - Evaluate nCxpxqnx for the values of n,x, and p...Ch. 10.4 - Evaluate nCxpxqnx for the values of n,x, and p...Ch. 10.4 - In Problems 7-12, a fair coin is tossed four...Ch. 10.4 - In Problems 7-12, a fair coin is tossed four...Ch. 10.4 - In Problems 7-12, a fair coin is tossed four...Ch. 10.4 - In Problems 7-12, a fair coin is tossed four...Ch. 10.4 - In Problems 7-12, a fair coin is tossed four...Ch. 10.4 - In Problems 7-12, a fair coin is tossed four...Ch. 10.4 - In Problems 13-18 construct a histogram for the...Ch. 10.4 - In Problems 13-18 construct a histogram for the...Ch. 10.4 - In Problems 13-18 construct a histogram for the...Ch. 10.4 - In Problems 13-18 construct a histogram for the...Ch. 10.4 - In Problems 13-18 construct a histogram for the...Ch. 10.4 - In Problems 13-18 construct a histogram for the...Ch. 10.4 - In Problems 19-24, round answers to four decimal...Ch. 10.4 - In Problems 19-24, round answers to four decimal...Ch. 10.4 - In Problems 19-24, round answers to four decimal...Ch. 10.4 - In Problems 19-24, round answers to four decimal...Ch. 10.4 - In Problems 19-24, round answers to four decimal...Ch. 10.4 - In Problems 19-24, round answers to four decimal...Ch. 10.4 - If a baseball player has a batting average of 350...Ch. 10.4 - If a true-false test with 10 questions is given,...Ch. 10.4 - A multiple-choice test consists of 10 questions,...Ch. 10.4 - If 60 of the electorate supports the mayor, what...Ch. 10.4 - Construct a histogram for each of the binomial...Ch. 10.4 - Construct a histogram for each of the binomial...Ch. 10.4 - Construct a histogram for each of the binomial...Ch. 10.4 - Construct a histogram for each of the binomial...Ch. 10.4 - A random variable represents the number of...Ch. 10.4 - A random variable represents the number of...Ch. 10.4 - In Problems 35 and 36 a coin is loaded so that the...Ch. 10.4 - In Problems 35 and 36 a coin is loaded so that the...Ch. 10.4 - Find conditions on p that guarantee the histogram...Ch. 10.4 - Consider two binomial distributions for 1,000...Ch. 10.4 - A random variable represents the number of heads...Ch. 10.4 - A random variable represents the number of times a...Ch. 10.4 - Management training each year a company selects a...Ch. 10.4 - Employee turnover. If the probability of a new...Ch. 10.4 - Quality control A manufacturing process produces,...Ch. 10.4 - Guarantees. A manufacturing process produces, on...Ch. 10.4 - Quality control. A manufacturing process produces,...Ch. 10.4 - Management training. Each year a company selects 5...Ch. 10.4 - Medical diagnosis A tuberculosis patient is given...Ch. 10.4 - Harmful drug side effect. A pharmaceutical...Ch. 10.4 - Genetics. The probability that brown-eyed parents,...Ch. 10.4 - Gene mutation the probability of gene mutation...Ch. 10.4 - Epidemics. If the probability of a person...Ch. 10.4 - Drug side effect the probability that a given drug...Ch. 10.4 - Testing A multiple-choice test is given with 5...Ch. 10.4 - Opinion polls. An opinion poll based on a small...Ch. 10.4 - Testing. A multiple-choice test is given with 5...Ch. 10.4 - Sociology. The probability that a marriage will...Ch. 10.4 - Sociology. If the probability is .55 that a...Ch. 10.5 - What percentage of the light bulbs in Example 1...Ch. 10.5 - Refer to Example 1. What is the probability that a...Ch. 10.5 - In Example 3, Use the normal curve to approximate...Ch. 10.5 - Suppose in Example 4 that the manufacturing...Ch. 10.5 - In Problems 1-6, use Appendix C to find the area...Ch. 10.5 - In Problems 1-6, use Appendix C to find the area...Ch. 10.5 - In Problems 1-6, use Appendix C to find the area...Ch. 10.5 - In Problems 1-6, use Appendix C to find the area...Ch. 10.5 - In Problems 1-6, use Appendix C to find the area...Ch. 10.5 - In Problems 1-6, use Appendix C to find the area...Ch. 10.5 - In Problems 7-14, use Appendix C to find the area...Ch. 10.5 - In Problems 7-14, use Appendix C to find the area...Ch. 10.5 - In Problems 7-14, use Appendix C to find the area...Ch. 10.5 - Prob. 10ECh. 10.5 - In Problems 7-14, use Appendix C to find the area...Ch. 10.5 - In Problems 7-14, use Appendix C to find the area...Ch. 10.5 - In Problems 7-14, use Appendix C to find the area...Ch. 10.5 - In Problems 7-14, use Appendix C to find the area...Ch. 10.5 - In Problems 15-20, given a normal distribution...Ch. 10.5 - In Problems 15-20, given a normal distribution...Ch. 10.5 - In Problems 15-20, given a normal distribution...Ch. 10.5 - In Problems 15-20, given a normal distribution...Ch. 10.5 - In Problems 15-20, given a normal distribution...Ch. 10.5 - In Problems 15-20, given a normal distribution...Ch. 10.5 - In Problems 21.26, given a normal distribution...Ch. 10.5 - In Problems 21.26, given a normal distribution...Ch. 10.5 - In Problems 21.26, given a normal distribution...Ch. 10.5 - In Problems 21.26, given a normal distribution...Ch. 10.5 - In Problems 21.26, given a normal distribution...Ch. 10.5 - In Problems 21.26, given a normal distribution...Ch. 10.5 - In Problems 27-34, consider the normal...Ch. 10.5 - In Problems 27-34, consider the normal...Ch. 10.5 - Consider the normal distribution with mean 60 and...Ch. 10.5 - In Problems 27-34, consider the normal...Ch. 10.5 - In Problems 27-34, consider the normal...Ch. 10.5 - In Problems 27-34, consider the normal...Ch. 10.5 - In Problems 27-34, consider the normal...Ch. 10.5 - In Problems 27-34, consider the normal...Ch. 10.5 - In Problems 35-40, discuss the validity of each...Ch. 10.5 - In Problems 35-40, discuss the validity of each...Ch. 10.5 - In Problems 35-40, discuss the validity of each...Ch. 10.5 - In Problems 35-40, discuss the validity of each...Ch. 10.5 - In Problems 35-40, discuss the validity of each...Ch. 10.5 - In Problems 35-40, discuss the validity of each...Ch. 10.5 - In Problems 41-48, use the rule-of-thumb test to...Ch. 10.5 - In Problems 41-48, use the rule-of-thumb test to...Ch. 10.5 - In Problems 41-48, use the rule-of-thumb test to...Ch. 10.5 - In Problems 41-48, use the rule-of-thumb test to...Ch. 10.5 - In Problems 41-48, use the rule-of-thumb test to...Ch. 10.5 - In Problems 41-48, use the rule-of-thumb test to...Ch. 10.5 - In Problems 41-48, use the rule-of-thumb test to...Ch. 10.5 - In Problems 41-48, use the rule-of-thumb test to...Ch. 10.5 - The probability of success in a Bernoulli trial is...Ch. 10.5 - For a binomial distribution with n=100, explain...Ch. 10.5 - A binomial experiment consists of 500 trials. The...Ch. 10.5 - A binomial experiment consists of 500 trials. The...Ch. 10.5 - A binomial experiment consists of 500 trials. The...Ch. 10.5 - A binomial experiment consists of 500 trials. The...Ch. 10.5 - A binomial experiment consists of 500 trials. The...Ch. 10.5 - A binomial experiment consists of 500 trials. The...Ch. 10.5 - A binomial experiment consists of 500 trials. The...Ch. 10.5 - A binomial experiment consists of 500 trials. The...Ch. 10.5 - To graph Problems 59-62, use a graphing calculator...Ch. 10.5 - To graph Problems 59-62, use a graphing calculator...Ch. 10.5 - To graph Problems 59-62, use a graphing calculator...Ch. 10.5 - To graph Problems 59-62, use a graphing calculator...Ch. 10.5 - (A) If 120 scores are chosen from a normal...Ch. 10.5 - (A) If 250 scores are chosen from a normal...Ch. 10.5 - Sales Salespeople for a solar technology company...Ch. 10.5 - Guarantees. The average lifetime for a car battery...Ch. 10.5 - Quality control. A manufacturing process produces...Ch. 10.5 - Quality control. An automated manufacturing...Ch. 10.5 - Marketing claims. A company claims that 60 of the...Ch. 10.5 - Labor relation A union representative 60 claims of...Ch. 10.5 - Medicine. The average healing time of a certain...Ch. 10.5 - Agriculture. The average height of a hay crop is...Ch. 10.5 - Genetics. In a family with 2 children, the...Ch. 10.5 - Genetics. In Problem 73, what is the approximate...Ch. 10.5 - Testing. Scholastic Aptitude Tests (SATs) are...Ch. 10.5 - Politics. Candidate Harkins claims that she will...Ch. 10.5 - Grading on a curve. An instructor grades on a...Ch. 10.5 - Psychology. A test devised to measure...Ch. 10 - Use a bar graph and a broken-line graph to graph...Ch. 10 - Use a pie graph to graph the data on educational...Ch. 10 - (A) Draw a histogram for the binomial distribution...Ch. 10 - For the set of sample measurements...Ch. 10 - If a normal distribution has a mean of 100 and a...Ch. 10 - Given the sample of 25 quiz scores listed in the...Ch. 10 - For the set of grouped sample data given in the...Ch. 10 - (A) Construct a histogram for the binomial...Ch. 10 - What are the mean and standard deviation for a...Ch. 10 - In Problems 10 and 11, discuss the validity of...Ch. 10 - In Problems 10 and 11, discuss the validity of...Ch. 10 - If the probability of success in a single trial of...Ch. 10 - Given a normal distribution with mean 50 and...Ch. 10 - A data set is formed by recording the sums of 100...Ch. 10 - For the sample quiz scores in Problem 6, find the...Ch. 10 - A fair die is rolled five times. What is the...Ch. 10 - Two dice are rolled three times. What is the...Ch. 10 - Ten students take an exam worth 100 points. (A)...Ch. 10 - In the last presidential election, 39 of a city’s...Ch. 10 - A random variable represents the number of wins in...Ch. 10 - Retail sales. The daily number of bad checks...Ch. 10 - Preference survey. Find the mean, median, and/or...Ch. 10 - Plant safety. The weekly record of reported...Ch. 10 - Personnel screening.The scores on a screening test...Ch. 10 - Market research A newspaper publisher claims that...Ch. 10 - Health care. A small town has three doctors on...
Additional Math Textbook Solutions
Find more solutions based on key concepts
If n is a counting number, bn, read______, indicates that there are n factors of b. The number b is called the_...
Algebra and Trigonometry (6th Edition)
Find the limits in Exercises 33–40. Are the functions continuous at the point being approached?
39.
University Calculus: Early Transcendentals (4th Edition)
CHECK POINT I You deposit $1000 in a saving account at a bank that has a rate of 4%. a. Find the amount, A, of ...
Thinking Mathematically (6th Edition)
Interpreting a P-Value In Exercises 3–8, the P-value for a hypothesis test is shown. Use the P-value to decide ...
Elementary Statistics: Picturing the World (7th Edition)
For a population containing N=902 individual, what code number would you assign for a. the first person on the ...
Basic Business Statistics, Student Value Edition
Explain the meaning of the term “statistically significant difference” in statistics terminology.
Intro Stats, Books a la Carte Edition (5th Edition)
Knowledge Booster


Learn more about
Need a deep-dive on the concept behind this application? Look no further. Learn more about this topic, subject and related others by exploring similar questions and additional content below.Similar questions
- nd ave a ction and ave an 48. The domain of f y=f'(x) x 1 2 (= x<0 x<0 = f(x) possible. Group Activity In Exercises 49 and 50, do the following. (a) Find the absolute extrema of f and where they occur. (b) Find any points of inflection. (c) Sketch a possible graph of f. 49. f is continuous on [0,3] and satisfies the following. X 0 1 2 3 f 0 2 0 -2 f' 3 0 does not exist -3 f" 0 -1 does not exist 0 ve tes where X 0 < x <1 1< x <2 2arrow_forwardMorningstar tracks the total return for a large number of mutual funds. The following table shows the total return and the number of funds for four categories of mutual funds. Click on the datafile logo to reference the data. DATA file Type of Fund Domestic Equity Number of Funds Total Return (%) 9191 4.65 International Equity 2621 18.15 Hybrid 1419 2900 11.36 6.75 Specialty Stock a. Using the number of funds as weights, compute the weighted average total return for these mutual funds. (to 2 decimals) % b. Is there any difficulty associated with using the "number of funds" as the weights in computing the weighted average total return in part (a)? Discuss. What else might be used for weights? The input in the box below will not be graded, but may be reviewed and considered by your instructor. c. Suppose you invested $10,000 in this group of mutual funds and diversified the investment by placing $2000 in Domestic Equity funds, $4000 in International Equity funds, $3000 in Specialty Stock…arrow_forwardThe days to maturity for a sample of five money market funds are shown here. The dollar amounts invested in the funds are provided. Days to Maturity 20 Dollar Value ($ millions) 20 12 30 7 10 5 6 15 10 Use the weighted mean to determine the mean number of days to maturity for dollars invested in these five money market funds (to 1 decimal). daysarrow_forwardc. What are the first and third quartiles? First Quartiles (to 1 decimals) Third Quartiles (to 4 decimals) × ☑ Which companies spend the most money on advertising? Business Insider maintains a list of the top-spending companies. In 2014, Procter & Gamble spent more than any other company, a whopping $5 billion. In second place was Comcast, which spent $3.08 billion (Business Insider website, December 2014). The top 12 companies and the amount each spent on advertising in billions of dollars are as follows. Click on the datafile logo to reference the data. DATA file Company Procter & Gamble Comcast Advertising ($billions) $5.00 3.08 2.91 Company American Express General Motors Advertising ($billions) $2.19 2.15 ETET AT&T Ford Verizon L'Oreal 2.56 2.44 2.34 Toyota Fiat Chrysler Walt Disney Company J.P Morgan a. What is the mean amount spent on advertising? (to 2 decimals) 2.55 b. What is the median amount spent on advertising? (to 3 decimals) 2.09 1.97 1.96 1.88arrow_forwardNumerically estimate the value of limx→2+x3−83x−9, rounded correctly to one decimal place. In the provided table below, you must enter your answers rounded exactly to the correct number of decimals, based on the Numerical Conventions for MATH1044 (see lecture notes 1.3 Actions page 3). If there are more rows provided in the table than you need, enter NA for those output values in the table that should not be used. x→2+ x3−83x−9 2.1 2.01 2.001 2.0001 2.00001 2.000001arrow_forwarde Grade Breakdown x Dashboard | Big Spring HX Dashboard | Big Spring H x Home | Lesson | Assessm cds.caolacourses.edisonlearning.com/lessons/assessmentplayer Co bigspringsd.org bookmarks Prodigy New Tab my video Brielynn... Algebra 2 Part 1-Exam-EDCP.MA003.A D Question 6 D ? 10 17°F Mostly sunny BSMS Home Significant Events in... Classes 25 26 27 28 29 30 31 32 33 34 35 36 37 38 39 40 Solve using row operations: x-3y= -4; 2x - y = 7 Use the paperclip button below to attach files. Student can enter max 2000 characters BISU DAIAAA X2 X2 T ② Type here Q Search e I ✓ Paragra Oarrow_forwardMartinez Auto Supplies has retail stores located in eight cities in California. The price they charge for a particular product in each city are vary because of differing competitive conditions. For instance, the price they charge for a case of a popular brand of motor oil in each city follows. Also shown are the number of cases that Martinez Auto sold last quarter in each city. City Price ($) Sales (cases) Bakersfield 34.99 501 Los Angeles 38.99 1425 Modesto 36.00 294 Oakland 33.59 882 Sacramento 40.99 715 San Diego 38.59 1088 San Francisco 39.59 1644 San Jose 37.99 819 Compute the average sales price per case for this product during the last quarter? Round your answer to two decimal places.arrow_forwardConsider the following data and corresponding weights. xi Weight(wi) 3.2 6 2.0 3 2.5 2 5.0 8 a. Compute the weighted mean (to 2 decimals). b. Compute the sample mean of the four data values without weighting. Note the difference in the results provided by the two computations (to 3 decimals).arrow_forwardExpert only,if you don't know it don't attempt it, no Artificial intelligence or screen shot it solvingarrow_forwardarrow_back_iosSEE MORE QUESTIONSarrow_forward_ios
Recommended textbooks for you
 Glencoe Algebra 1, Student Edition, 9780079039897...AlgebraISBN:9780079039897Author:CarterPublisher:McGraw Hill
 Holt Mcdougal Larson Pre-algebra: Student Edition...AlgebraISBN:9780547587776Author:HOLT MCDOUGALPublisher:HOLT MCDOUGAL
Glencoe Algebra 1, Student Edition, 9780079039897...
Algebra
ISBN:9780079039897
Author:Carter
Publisher:McGraw Hill
Holt Mcdougal Larson Pre-algebra: Student Edition...
Algebra
ISBN:9780547587776
Author:HOLT MCDOUGAL
Publisher:HOLT MCDOUGAL
How to make Frequency Distribution Table / Tally Marks and Frequency Distribution Table; Author: Reenu Math;https://www.youtube.com/watch?v=i_A6RiE8tLE;License: Standard YouTube License, CC-BY
Frequency distribution table in statistics; Author: Math and Science;https://www.youtube.com/watch?v=T7KYO76DoOE;License: Standard YouTube License, CC-BY
Frequency Distribution Table for Grouped/Continuous data | Math Dot Com; Author: Maths dotcom;https://www.youtube.com/watch?v=ErnccbXQOPY;License: Standard Youtube License