
Videos
Commute times. Thirty-two people were chosen at random from among the employees of a large corporation. Their commute times (in hours) from home to work were recorded in the following table:
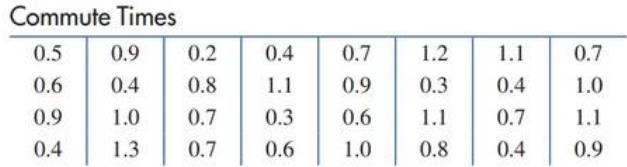
(A) Construct a frequency and relative frequency table using a class interval width of
starting at
(B) Construct a histogram.
(C) What is the probability that a person chosen at random from the sample will have a
commuting time of at least an hour? Of at most half an hour?
(D) Construct a histogram using a graphing calculator
Want to see the full answer?
Check out a sample textbook solution
Chapter 10 Solutions
Finite Mathematics for Business, Economics, Life Sciences and Social Sciences
Additional Math Textbook Solutions
College Algebra with Modeling & Visualization (5th Edition)
University Calculus: Early Transcendentals (4th Edition)
Algebra and Trigonometry (6th Edition)
Elementary Statistics (13th Edition)
A Problem Solving Approach To Mathematics For Elementary School Teachers (13th Edition)


- Please Help me answer this linear algebra question. This is a practice textbook question.arrow_forward1. a scientist observed a bacterium in a microscope. it measured about .0000029 meter in diameter which of the following is closest to it? A- 2 x 10^-6, B- 2 x 10^-5, C- 3 x 10^-5, or D- 3 x 10^-6 2.express the product of 500 and 400 in scientific notation. is it 2 x 10^5 or 2 x 10^4 or 2 x 10^3 or 20 x 10^4arrow_forwardExample 4 (Part 1) One of the datasets in the Lock book contains information about 215 countries of the world. One of the variables is the percentage of people in the country who have access to the internet. We have data for 203 of those countries. The plot on the right shows a dotplot of the data. 1. What are the cases? Population n = 203, mean = 43.024 median = 43.5, stdev = 29.259 20 2. What does each dot on the dotplot represent? 15 10 5 20 40 43.024 60 80 3. What type of data is do we collect from the cases, quantitative or categorical?arrow_forward
- No chatgpt pls will upvotearrow_forwardi dont know the anserarrow_forwardLet x be a random variable that represents the percentage of successful free throws a professional basketball player makes in a season. Let y be a random variable that represents the percentage of successful field goals a professional basketball player makes in a season. A random sample of n =6 professional basketball players gave the following information. x 63 79 70 80 84 87 y 46 49 45 55 57 58 Find Se. Round your answer to three decimal places.arrow_forward
 Glencoe Algebra 1, Student Edition, 9780079039897...AlgebraISBN:9780079039897Author:CarterPublisher:McGraw Hill
 Big Ideas Math A Bridge To Success Algebra 1: Stu...AlgebraISBN:9781680331141Author:HOUGHTON MIFFLIN HARCOURTPublisher:Houghton Mifflin Harcourt
 Holt Mcdougal Larson Pre-algebra: Student Edition...AlgebraISBN:9780547587776Author:HOLT MCDOUGALPublisher:HOLT MCDOUGAL