
Finite Mathematics for Business, Economics, Life Sciences and Social Sciences
14th Edition
ISBN: 9780134677972
Author: Barnett
Publisher: PEARSON
expand_more
expand_more
format_list_bulleted
Concept explainers
Videos
Textbook Question
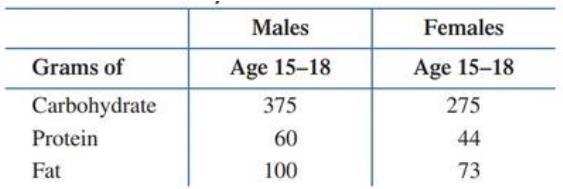
Chapter 10.1, Problem 19E
Nutrition. Graph the data in the following table using a double bar graph.

Expert Solution & Answer
Want to see the full answer?
Check out a sample textbook solution
Students have asked these similar questions
graph the data
So I'll include a line graph for a second visual aid. I have a chart to show the proportion of students by major that have student loan debt at our school.
3. What is the best type of graph for the data set below?
Acme Co. sales data
% of
total sales
Product
Toothpaste
Hand soap
Mouthwash
Shampoo
Deodorant
O A. Bar graph
O B. Line graph
Oo. Pie chart
OD. Scatter plot
34
Chapter 10 Solutions
Finite Mathematics for Business, Economics, Life Sciences and Social Sciences
Ch. 10.1 - (A) Using Figure 3, estimate the median annual...Ch. 10.1 - (A) Using Figure 6 estimate the revenue and costs...Ch. 10.1 - Repeat Example 1 for the following intervals: (A)...Ch. 10.1 - The weights (in pounds) were recorded for 20...Ch. 10.1 - (A) Construct a frequency table and histogram for...Ch. 10.1 - (A) Construct a frequency table and histogram for...Ch. 10.1 - Gross domestic product. Graph the data in the...Ch. 10.1 - Corporation revenues. Graph the data in the...Ch. 10.1 - Gold production. Use the double bar graph on world...Ch. 10.1 - Gasoline prices .Graph the data in the following...
Ch. 10.1 - Postal service. Graph the data in the following...Ch. 10.1 - Postal service. Refer to Problem 9. If the data...Ch. 10.1 - Federal income. Graph the data in the following...Ch. 10.1 - Gasoline prices. In April 2017 the average price...Ch. 10.1 - Starting salaries. The starting salaries (in...Ch. 10.1 - Commute times. Thirty-two people were chosen at...Ch. 10.1 - Common stocks. The following table shows...Ch. 10.1 - Mouse weights. One hundred healthy mice were...Ch. 10.1 - Population growth. Graph the data in the following...Ch. 10.1 - Aims epidemic. One way to gauge the toll of the...Ch. 10.1 - Nutrition. Graph the data in the following table...Ch. 10.1 - Greenhouse gases. The U.S. Environmental...Ch. 10.1 - Nutrition. Graph the nutritional information in...Ch. 10.1 - Nutrition. Refer to Problem 21. Suppose that you...Ch. 10.1 - Education. For statistical studies, U.S. states...Ch. 10.1 - Study abroad. Would a pie graph be more effective...Ch. 10.1 - Median age. Use the broken-line graph shown to...Ch. 10.1 - State prisoners. In 1980 in the United States, 6...Ch. 10.1 - Grade point Averages. One hundred seniors were...Ch. 10.2 - For many sets of measurements the median lies...Ch. 10.2 - Find the mean for the sample measurements...Ch. 10.2 - Compute the mean for the grouped sample data...Ch. 10.2 - Add the salary $100,000 to those in Example 3 and...Ch. 10.2 - Find the median for the grouped data in the...Ch. 10.2 - Compute the mode(s), median, and mean for each...Ch. 10.2 - In Problems 1-4, find the mean of the data set....Ch. 10.2 - In Problems 1-4, find the mean of the data set....Ch. 10.2 - In Problems 1-4, find the mean of the data set....Ch. 10.2 - In Problems 1-4, find the mean of the data set....Ch. 10.2 - In Problems 5-8, find the indicated sum. (If...Ch. 10.2 - In Problems 5-8, find the indicated sum. (If...Ch. 10.2 - In Problems 5-8, find the indicated sum. (If...Ch. 10.2 - In Problems 5-8, find the indicated sum. (If...Ch. 10.2 - Find the mean, median, and mode for the sets of...Ch. 10.2 - Find the mean, median, and mode for the sets of...Ch. 10.2 - Find the mean, median, and/or mode, whichever are...Ch. 10.2 - Find the mean, median, and/or mode, whichever are...Ch. 10.2 - Find the mean for the sets of grouped data in...Ch. 10.2 - Find the mean for the sets of grouped data in...Ch. 10.2 - Which single measure of central tendency-mean,...Ch. 10.2 - Which single measure of central tendency mean,...Ch. 10.2 - A data set is formed by recording the results of...Ch. 10.2 - A data set is formed by recording the sums on 200...Ch. 10.2 - (A) Construct a set of four numbers that has mean...Ch. 10.2 - (A) Construct a set of five numbers that has mean...Ch. 10.2 - Price earnings ratios. Find the mean, median, and...Ch. 10.2 - Gasoline tax. Find the mean, median, and mode for...Ch. 10.2 - Light bulb lifetime. Find the mean and median for...Ch. 10.2 - Price earnings ratios. Find the mean and median...Ch. 10.2 - Student loan debt. Find the mean median, and mode...Ch. 10.2 - Tourism Find the mean, median, and mode for the...Ch. 10.2 - Mouse weights. Find the mean and median for the...Ch. 10.2 - Blood cholesterol levels. Find the mean and median...Ch. 10.2 - Immigration Find the mean, median, and mode for...Ch. 10.2 - Grade point averages. Find the mean and median for...Ch. 10.2 - Entrance examination scores. Compute the median...Ch. 10.2 - Presidents. Find the mean and median for the...Ch. 10.3 - (A) When is the sample standard deviation of a set...Ch. 10.3 - Find the standard deviation for the sample...Ch. 10.3 - Find the standard deviation for the grouped sample...Ch. 10.3 - Prob. 1ECh. 10.3 - In Problems 1-8, find the indicated sum. (If...Ch. 10.3 - In Problems 1-8, find the indicated sum. (If...Ch. 10.3 - In Problems 1-8, find the indicated sum. (If...Ch. 10.3 - In Problems 1-8, find the indicated sum. (If...Ch. 10.3 - In Problems 1-8, find the indicated sum. (If...Ch. 10.3 - In Problems 1-8, find the indicated sum. (If...Ch. 10.3 - In Problems 1-8, find the indicated sum. (If...Ch. 10.3 - (A) Find set of the ungrouped mean and sample...Ch. 10.3 - (A) Find the mean and standard deviation of the...Ch. 10.3 - In Problems 11 and 12, find the standard deviation...Ch. 10.3 - In Problems 11 and 12, find the standard deviation...Ch. 10.3 - In Problems 13-18, discuss the validity of each...Ch. 10.3 - In Problems 13-18, discuss the validity of each...Ch. 10.3 - In Problems 13-18, discuss the validity of each...Ch. 10.3 - In Problems 13-18, discuss the validity of each...Ch. 10.3 - In Problems 13-18, discuss the validity of each...Ch. 10.3 - In Problems 13-18, discuss the validity of each...Ch. 10.3 - A data set is formed by recording the sums in 100...Ch. 10.3 - A data set is formed by recording the results of...Ch. 10.3 - Find the mean and standard deviation for each of...Ch. 10.3 - Find the mean and standard deviation for each of...Ch. 10.3 - Find the mean and standard deviation for each of...Ch. 10.3 - Find the mean and standard deviation for each of...Ch. 10.3 - Find the mean and standard deviation for each of...Ch. 10.3 - Find the mean and standard deviation for each of...Ch. 10.3 - Find the mean and standard deviation for each of...Ch. 10.3 - Find the mean and standard deviation for each of...Ch. 10.4 - Find p and q for a single roll of a fair die,...Ch. 10.4 - In Example 2, find the probability of the outcome...Ch. 10.4 - Using the same die experiment as in Example 3,...Ch. 10.4 - Use the binomial formula to expand q+p4.Ch. 10.4 - Repeat Example 5, where the binomial experiment...Ch. 10.4 - Compute the mean and standard deviation for the...Ch. 10.4 - Repeat Example 7 for four patients. The...Ch. 10.4 - Evaluate nCxpxqnx for the values of n,x, and p...Ch. 10.4 - Evaluate nCxpxqnx for the values of n,x, and p...Ch. 10.4 - Evaluate nCxpxqnx for the values of n,x, and p...Ch. 10.4 - Evaluate nCxpxqnx for the values of n,x, and p...Ch. 10.4 - Evaluate nCxpxqnx for the values of n,x, and p...Ch. 10.4 - Evaluate nCxpxqnx for the values of n,x, and p...Ch. 10.4 - In Problems 7-12, a fair coin is tossed four...Ch. 10.4 - In Problems 7-12, a fair coin is tossed four...Ch. 10.4 - In Problems 7-12, a fair coin is tossed four...Ch. 10.4 - In Problems 7-12, a fair coin is tossed four...Ch. 10.4 - In Problems 7-12, a fair coin is tossed four...Ch. 10.4 - In Problems 7-12, a fair coin is tossed four...Ch. 10.4 - In Problems 13-18 construct a histogram for the...Ch. 10.4 - In Problems 13-18 construct a histogram for the...Ch. 10.4 - In Problems 13-18 construct a histogram for the...Ch. 10.4 - In Problems 13-18 construct a histogram for the...Ch. 10.4 - In Problems 13-18 construct a histogram for the...Ch. 10.4 - In Problems 13-18 construct a histogram for the...Ch. 10.4 - In Problems 19-24, round answers to four decimal...Ch. 10.4 - In Problems 19-24, round answers to four decimal...Ch. 10.4 - In Problems 19-24, round answers to four decimal...Ch. 10.4 - In Problems 19-24, round answers to four decimal...Ch. 10.4 - In Problems 19-24, round answers to four decimal...Ch. 10.4 - In Problems 19-24, round answers to four decimal...Ch. 10.4 - If a baseball player has a batting average of 350...Ch. 10.4 - If a true-false test with 10 questions is given,...Ch. 10.4 - A multiple-choice test consists of 10 questions,...Ch. 10.4 - If 60 of the electorate supports the mayor, what...Ch. 10.4 - Construct a histogram for each of the binomial...Ch. 10.4 - Construct a histogram for each of the binomial...Ch. 10.4 - Construct a histogram for each of the binomial...Ch. 10.4 - Construct a histogram for each of the binomial...Ch. 10.4 - A random variable represents the number of...Ch. 10.4 - A random variable represents the number of...Ch. 10.4 - In Problems 35 and 36 a coin is loaded so that the...Ch. 10.4 - In Problems 35 and 36 a coin is loaded so that the...Ch. 10.4 - Find conditions on p that guarantee the histogram...Ch. 10.4 - Consider two binomial distributions for 1,000...Ch. 10.4 - A random variable represents the number of heads...Ch. 10.4 - A random variable represents the number of times a...Ch. 10.4 - Management training each year a company selects a...Ch. 10.4 - Employee turnover. If the probability of a new...Ch. 10.4 - Quality control A manufacturing process produces,...Ch. 10.4 - Guarantees. A manufacturing process produces, on...Ch. 10.4 - Quality control. A manufacturing process produces,...Ch. 10.4 - Management training. Each year a company selects 5...Ch. 10.4 - Medical diagnosis A tuberculosis patient is given...Ch. 10.4 - Harmful drug side effect. A pharmaceutical...Ch. 10.4 - Genetics. The probability that brown-eyed parents,...Ch. 10.4 - Gene mutation the probability of gene mutation...Ch. 10.4 - Epidemics. If the probability of a person...Ch. 10.4 - Drug side effect the probability that a given drug...Ch. 10.4 - Testing A multiple-choice test is given with 5...Ch. 10.4 - Opinion polls. An opinion poll based on a small...Ch. 10.4 - Testing. A multiple-choice test is given with 5...Ch. 10.4 - Sociology. The probability that a marriage will...Ch. 10.4 - Sociology. If the probability is .55 that a...Ch. 10.5 - What percentage of the light bulbs in Example 1...Ch. 10.5 - Refer to Example 1. What is the probability that a...Ch. 10.5 - In Example 3, Use the normal curve to approximate...Ch. 10.5 - Suppose in Example 4 that the manufacturing...Ch. 10.5 - In Problems 1-6, use Appendix C to find the area...Ch. 10.5 - In Problems 1-6, use Appendix C to find the area...Ch. 10.5 - In Problems 1-6, use Appendix C to find the area...Ch. 10.5 - In Problems 1-6, use Appendix C to find the area...Ch. 10.5 - In Problems 1-6, use Appendix C to find the area...Ch. 10.5 - In Problems 1-6, use Appendix C to find the area...Ch. 10.5 - In Problems 7-14, use Appendix C to find the area...Ch. 10.5 - In Problems 7-14, use Appendix C to find the area...Ch. 10.5 - In Problems 7-14, use Appendix C to find the area...Ch. 10.5 - Prob. 10ECh. 10.5 - In Problems 7-14, use Appendix C to find the area...Ch. 10.5 - In Problems 7-14, use Appendix C to find the area...Ch. 10.5 - In Problems 7-14, use Appendix C to find the area...Ch. 10.5 - In Problems 7-14, use Appendix C to find the area...Ch. 10.5 - In Problems 15-20, given a normal distribution...Ch. 10.5 - In Problems 15-20, given a normal distribution...Ch. 10.5 - In Problems 15-20, given a normal distribution...Ch. 10.5 - In Problems 15-20, given a normal distribution...Ch. 10.5 - In Problems 15-20, given a normal distribution...Ch. 10.5 - In Problems 15-20, given a normal distribution...Ch. 10.5 - In Problems 21.26, given a normal distribution...Ch. 10.5 - In Problems 21.26, given a normal distribution...Ch. 10.5 - In Problems 21.26, given a normal distribution...Ch. 10.5 - In Problems 21.26, given a normal distribution...Ch. 10.5 - In Problems 21.26, given a normal distribution...Ch. 10.5 - In Problems 21.26, given a normal distribution...Ch. 10.5 - In Problems 27-34, consider the normal...Ch. 10.5 - In Problems 27-34, consider the normal...Ch. 10.5 - Consider the normal distribution with mean 60 and...Ch. 10.5 - In Problems 27-34, consider the normal...Ch. 10.5 - In Problems 27-34, consider the normal...Ch. 10.5 - In Problems 27-34, consider the normal...Ch. 10.5 - In Problems 27-34, consider the normal...Ch. 10.5 - In Problems 27-34, consider the normal...Ch. 10.5 - In Problems 35-40, discuss the validity of each...Ch. 10.5 - In Problems 35-40, discuss the validity of each...Ch. 10.5 - In Problems 35-40, discuss the validity of each...Ch. 10.5 - In Problems 35-40, discuss the validity of each...Ch. 10.5 - In Problems 35-40, discuss the validity of each...Ch. 10.5 - In Problems 35-40, discuss the validity of each...Ch. 10.5 - In Problems 41-48, use the rule-of-thumb test to...Ch. 10.5 - In Problems 41-48, use the rule-of-thumb test to...Ch. 10.5 - In Problems 41-48, use the rule-of-thumb test to...Ch. 10.5 - In Problems 41-48, use the rule-of-thumb test to...Ch. 10.5 - In Problems 41-48, use the rule-of-thumb test to...Ch. 10.5 - In Problems 41-48, use the rule-of-thumb test to...Ch. 10.5 - In Problems 41-48, use the rule-of-thumb test to...Ch. 10.5 - In Problems 41-48, use the rule-of-thumb test to...Ch. 10.5 - The probability of success in a Bernoulli trial is...Ch. 10.5 - For a binomial distribution with n=100, explain...Ch. 10.5 - A binomial experiment consists of 500 trials. The...Ch. 10.5 - A binomial experiment consists of 500 trials. The...Ch. 10.5 - A binomial experiment consists of 500 trials. The...Ch. 10.5 - A binomial experiment consists of 500 trials. The...Ch. 10.5 - A binomial experiment consists of 500 trials. The...Ch. 10.5 - A binomial experiment consists of 500 trials. The...Ch. 10.5 - A binomial experiment consists of 500 trials. The...Ch. 10.5 - A binomial experiment consists of 500 trials. The...Ch. 10.5 - To graph Problems 59-62, use a graphing calculator...Ch. 10.5 - To graph Problems 59-62, use a graphing calculator...Ch. 10.5 - To graph Problems 59-62, use a graphing calculator...Ch. 10.5 - To graph Problems 59-62, use a graphing calculator...Ch. 10.5 - (A) If 120 scores are chosen from a normal...Ch. 10.5 - (A) If 250 scores are chosen from a normal...Ch. 10.5 - Sales Salespeople for a solar technology company...Ch. 10.5 - Guarantees. The average lifetime for a car battery...Ch. 10.5 - Quality control. A manufacturing process produces...Ch. 10.5 - Quality control. An automated manufacturing...Ch. 10.5 - Marketing claims. A company claims that 60 of the...Ch. 10.5 - Labor relation A union representative 60 claims of...Ch. 10.5 - Medicine. The average healing time of a certain...Ch. 10.5 - Agriculture. The average height of a hay crop is...Ch. 10.5 - Genetics. In a family with 2 children, the...Ch. 10.5 - Genetics. In Problem 73, what is the approximate...Ch. 10.5 - Testing. Scholastic Aptitude Tests (SATs) are...Ch. 10.5 - Politics. Candidate Harkins claims that she will...Ch. 10.5 - Grading on a curve. An instructor grades on a...Ch. 10.5 - Psychology. A test devised to measure...Ch. 10 - Use a bar graph and a broken-line graph to graph...Ch. 10 - Use a pie graph to graph the data on educational...Ch. 10 - (A) Draw a histogram for the binomial distribution...Ch. 10 - For the set of sample measurements...Ch. 10 - If a normal distribution has a mean of 100 and a...Ch. 10 - Given the sample of 25 quiz scores listed in the...Ch. 10 - For the set of grouped sample data given in the...Ch. 10 - (A) Construct a histogram for the binomial...Ch. 10 - What are the mean and standard deviation for a...Ch. 10 - In Problems 10 and 11, discuss the validity of...Ch. 10 - In Problems 10 and 11, discuss the validity of...Ch. 10 - If the probability of success in a single trial of...Ch. 10 - Given a normal distribution with mean 50 and...Ch. 10 - A data set is formed by recording the sums of 100...Ch. 10 - For the sample quiz scores in Problem 6, find the...Ch. 10 - A fair die is rolled five times. What is the...Ch. 10 - Two dice are rolled three times. What is the...Ch. 10 - Ten students take an exam worth 100 points. (A)...Ch. 10 - In the last presidential election, 39 of a city’s...Ch. 10 - A random variable represents the number of wins in...Ch. 10 - Retail sales. The daily number of bad checks...Ch. 10 - Preference survey. Find the mean, median, and/or...Ch. 10 - Plant safety. The weekly record of reported...Ch. 10 - Personnel screening.The scores on a screening test...Ch. 10 - Market research A newspaper publisher claims that...Ch. 10 - Health care. A small town has three doctors on...
Additional Math Textbook Solutions
Find more solutions based on key concepts
For the following exercises, find the Lengths of the functions of y over the given interval. If you cannot eval...
Calculus Volume 2
Percentiles. The pth percentile of a sorted data set is a number xp such that p of the data fall at or below xp...
Excursions in Modern Mathematics (9th Edition)
CHECK POINT 1 Write a word description of the set L = {a, b, c, d, e, f}.
Thinking Mathematically (6th Edition)
Solve each problem involving proportions. Price of Gasoline If 6 gallons of premium unleaded gasoline cost $17....
Mathematical Ideas (13th Edition) - Standalone book
Radioisotopes and Cancer Detection. A radioisotope commonly used in the detection of breast cancer is technetiu...
Fundamentals of Differential Equations and Boundary Value Problems
19-28: Theoretical Probabilities. Use the theoretical method to deter mine the probability of the following out...
Using & Understanding Mathematics: A Quantitative Reasoning Approach (7th Edition)
Knowledge Booster


Learn more about
Need a deep-dive on the concept behind this application? Look no further. Learn more about this topic, subject and related others by exploring similar questions and additional content below.Similar questions
- The data on energy consumption in the agricultural sector is displayed: Types of Energy (direct and indirect) Electricity Fertilizers Natural gas Pesticides Gasoline Diesel What type of graph best represents this data? Select a Choice Below A Line graph Scatterplot Pie chart D Bar grapharrow_forwardShown in the table below are the one-way airfares between 5 cities5 . Create a graph showing this data. Honolulu Moscow London Cairo Seattle $159 $370 $654 $684 Honolulu $830 $854 $801 London $245 $323 Moscow $329arrow_forwardDescribe the three primary charts and graphs used to organize and display data.arrow_forward
- Considering the victories for each baseball league time in 2006 in image below, Plot a Box-plot (box-and-moustache) graph using EXCEL.arrow_forwardHere are the numbers of robberies in New York City, according to the New York Police Department (NYPD), for 2000 through 2017. Display these data in a graph. Year: 2000 2001 2002 2003 2004 Count: 32,562 28,202 27,229 25,989 24,373 Year: 2005 2006 2007 2008 2009 Count: 24,722 23,739 21,809 22,401 18,601 Year: 2010 2011 2012 2013 Count: 19,486 19,717 20,144 19,128 Year: 2014 2015 2016 2017 Count: 16,539 16,931 15,500 13,956 Click to download the data in your preferred format. CSV Excel JMP Mac-Text Minitab PC-Text R SPSS TI CrunchIt! What are the most important facts that the data show? The crime rate appears to be leveling off. The largest percentage decrease in the crime rate was between 2000 and 2001. In another 17 years, the crime rate will be close to zero. There were less than half as many robberies in 2017 than there were in 2000. Robberies decreased overall from 2000 to 2017, with occasional…arrow_forwardUse the data in the table below to complete parts (a) through (c). 5 10 14 18 18 42 30 38 22 25 27 22 20 3 Click the icon to view the steps for finding influential points. (a) Construct a scatterplot of the data. Choose the correct graph below. O A. OB. Oc. OD. Ay 40- Ay 12- Ay 12- Ay 501 0- -12- -12- 0- 40arrow_forward
- What type of graphs( such as bar, histogram, etc) would be best to use to depict the relationship between the following variables? Please state the reason why the chosen graph was selected. how the number of days in theICU(intensive care unit) differ by renal failure status. the association between the number of days in the ICU and the number of hours in the operating room. the association between the number of days in the ICU and the number of hours on the bypass pump? the association between the number of hours in the operating room and the number of hours on a bypass pump? the relationship between the number of days in the ICU and gender?arrow_forwardExplain what is misleading about the graph below. 2012 PRESIDENTIAL RUN GOP CANDIDATES BACK PALIN 70% 63% 60% BACK HUCKABEE BACK ROMNEY FOX SOURCE:OPINIONS 47 EE DYNAMICarrow_forwardGraph the set of data using the appropriate type of graph (bar graph, line graph, scatter graph, or pie chart) TABLE 5 Favorite Vegetables Boys Girls Broccoli 2 5 Carrots 6 7 Corn 10 8 Peas 8 5 Squash 5 6arrow_forward
- A company wants to open a new canteen for its employees. To determine its viability, they send an email with a link for employees to complete the survey. They randomly select 4 departments and ask all employees in the selected departments how frequently they would buy lunch at the canteen. The possible responses are never, sometimes, every day. What would be the most appropriate graph to use to represent this data? Select one: Side-by-side boxplot Pie chart Stemplot Cumulative frequency ogive Histogramarrow_forward2. What type of graph would you use to display the data in this table? Number of Stolen Bicycles in One Month in Selected Cities North Bay Hamilton Barrie Guelph 153 Ottawa Toronto City Bicycles stolen 190 45 65 874 90 b. Circle graph Bar graph d. Scatter plot a. Histogram С.arrow_forwardGiven the data as shown in the table below X Y 5 4 9 5 10 Use technology to graph the scatterplot and the best-fit line of the data. Find your corect graph belowarrow_forward
arrow_back_ios
SEE MORE QUESTIONS
arrow_forward_ios
Recommended textbooks for you
 Functions and Change: A Modeling Approach to Coll...AlgebraISBN:9781337111348Author:Bruce Crauder, Benny Evans, Alan NoellPublisher:Cengage Learning
 Glencoe Algebra 1, Student Edition, 9780079039897...AlgebraISBN:9780079039897Author:CarterPublisher:McGraw Hill
 Big Ideas Math A Bridge To Success Algebra 1: Stu...AlgebraISBN:9781680331141Author:HOUGHTON MIFFLIN HARCOURTPublisher:Houghton Mifflin Harcourt
 Holt Mcdougal Larson Pre-algebra: Student Edition...AlgebraISBN:9780547587776Author:HOLT MCDOUGALPublisher:HOLT MCDOUGAL
 Algebra: Structure And Method, Book 1AlgebraISBN:9780395977224Author:Richard G. Brown, Mary P. Dolciani, Robert H. Sorgenfrey, William L. ColePublisher:McDougal Littell
Functions and Change: A Modeling Approach to Coll...
Algebra
ISBN:9781337111348
Author:Bruce Crauder, Benny Evans, Alan Noell
Publisher:Cengage Learning
Glencoe Algebra 1, Student Edition, 9780079039897...
Algebra
ISBN:9780079039897
Author:Carter
Publisher:McGraw Hill
Big Ideas Math A Bridge To Success Algebra 1: Stu...
Algebra
ISBN:9781680331141
Author:HOUGHTON MIFFLIN HARCOURT
Publisher:Houghton Mifflin Harcourt
Holt Mcdougal Larson Pre-algebra: Student Edition...
Algebra
ISBN:9780547587776
Author:HOLT MCDOUGAL
Publisher:HOLT MCDOUGAL
Algebra: Structure And Method, Book 1
Algebra
ISBN:9780395977224
Author:Richard G. Brown, Mary P. Dolciani, Robert H. Sorgenfrey, William L. Cole
Publisher:McDougal Littell
The Shape of Data: Distributions: Crash Course Statistics #7; Author: CrashCourse;https://www.youtube.com/watch?v=bPFNxD3Yg6U;License: Standard YouTube License, CC-BY
Shape, Center, and Spread - Module 20.2 (Part 1); Author: Mrmathblog;https://www.youtube.com/watch?v=COaid7O_Gag;License: Standard YouTube License, CC-BY
Shape, Center and Spread; Author: Emily Murdock;https://www.youtube.com/watch?v=_YyW0DSCzpM;License: Standard Youtube License