
Concept explainers
Videos
Children and Happiness The data in the table come from a General Social Survey. The top row is the number of children reported for the respondents. The respondents also reported their level of happiness; Very H means Very Happy, and so on. The counts are shown in the table. Is happiness associated with having at least one child?
General Happiness
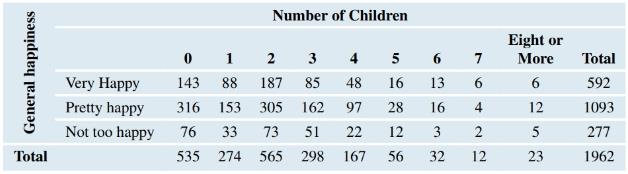
a. Merge all the Number of Children categories into two groups: those who have 0 children and those who have at least 1 child. For the rows, merge the Very Happy and Pretty Happy into one group called Happy. Rename the Not Too Happy group Not Happy. Report the new table, which should have two rows and two columns.
b. We wish to test whether happiness is associated with having children. Why was it necessary to merge categories?
c. With the merged data, determine whether there is an association between happiness and whether a person has at least one child. Use a significance level of
Want to see the full answer?
Check out a sample textbook solution
Chapter 10 Solutions
Introductory Statistics
Additional Math Textbook Solutions
Precalculus: Mathematics for Calculus (Standalone Book)
Elementary Statistics ( 3rd International Edition ) Isbn:9781260092561
Probability And Statistical Inference (10th Edition)
APPLIED STAT.IN BUS.+ECONOMICS
Elementary Statistics: Picturing the World (7th Edition)


- Should you be confident in applying your regression equation to estimate the heart rate of a python at 35°C? Why or why not?arrow_forwardGiven your fitted regression line, what would be the residual for snake #5 (10 C)?arrow_forwardCalculate the 95% confidence interval around your estimate of r using Fisher’s z-transformation. In your final answer, make sure to back-transform to the original units.arrow_forward
- BUSINESS DISCUSSarrow_forwardA researcher wishes to estimate, with 90% confidence, the population proportion of adults who support labeling legislation for genetically modified organisms (GMOs). Her estimate must be accurate within 4% of the true proportion. (a) No preliminary estimate is available. Find the minimum sample size needed. (b) Find the minimum sample size needed, using a prior study that found that 65% of the respondents said they support labeling legislation for GMOs. (c) Compare the results from parts (a) and (b). ... (a) What is the minimum sample size needed assuming that no prior information is available? n = (Round up to the nearest whole number as needed.)arrow_forwardThe table available below shows the costs per mile (in cents) for a sample of automobiles. At a = 0.05, can you conclude that at least one mean cost per mile is different from the others? Click on the icon to view the data table. Let Hss, HMS, HLS, Hsuv and Hмy represent the mean costs per mile for small sedans, medium sedans, large sedans, SUV 4WDs, and minivans respectively. What are the hypotheses for this test? OA. Ho: Not all the means are equal. Ha Hss HMS HLS HSUV HMV B. Ho Hss HMS HLS HSUV = μMV Ha: Hss *HMS *HLS*HSUV * HMV C. Ho Hss HMS HLS HSUV =μMV = = H: Not all the means are equal. D. Ho Hss HMS HLS HSUV HMV Ha Hss HMS HLS =HSUV = HMVarrow_forward
 Holt Mcdougal Larson Pre-algebra: Student Edition...AlgebraISBN:9780547587776Author:HOLT MCDOUGALPublisher:HOLT MCDOUGAL
 Glencoe Algebra 1, Student Edition, 9780079039897...AlgebraISBN:9780079039897Author:CarterPublisher:McGraw Hill
 Big Ideas Math A Bridge To Success Algebra 1: Stu...AlgebraISBN:9781680331141Author:HOUGHTON MIFFLIN HARCOURTPublisher:Houghton Mifflin Harcourt
 Functions and Change: A Modeling Approach to Coll...AlgebraISBN:9781337111348Author:Bruce Crauder, Benny Evans, Alan NoellPublisher:Cengage Learning