
Concept explainers
Videos
Preschool Attendance and High School Graduation Rates (Example 7) The Perry Preschool Project was created in the early 1960s by David Weikart in Ypsilanti, Michigan. One hundred twenty three African American children were randomly assigned to one of two groups: One group enrolled in the Perry Preschool, and one did not enroll. Follow-up studies were done for decades to answer the research question of whether attendance at preschool had an effect on high school graduation. The table shows whether the students graduated from regular high school or not. Students who received GEDs were counted as not graduating from high school. This table includes 121 of the original 123. This is a test of homogeneity, because the students were randomized into two distinct samples. (Schweinhart et al. 2005)
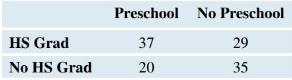
a. For those who attended preschool, the high school graduation rate was 37/57, or
b. Are attendance at preschool and high school graduation associated? Use a
Want to see the full answer?
Check out a sample textbook solution
Chapter 10 Solutions
Introductory Statistics
Additional Math Textbook Solutions
College Algebra (7th Edition)
Elementary Statistics: Picturing the World (7th Edition)
Basic College Mathematics
APPLIED STAT.IN BUS.+ECONOMICS
Precalculus: A Unit Circle Approach (3rd Edition)
Calculus for Business, Economics, Life Sciences, and Social Sciences (14th Edition)


- A marketing agency wants to determine whether different advertising platforms generate significantly different levels of customer engagement. The agency measures the average number of daily clicks on ads for three platforms: Social Media, Search Engines, and Email Campaigns. The agency collects data on daily clicks for each platform over a 10-day period and wants to test whether there is a statistically significant difference in the mean number of daily clicks among these platforms. Conduct ANOVA test. You can provide your answer by inserting a text box and the answer must include: also please provide a step by on getting the answers in excel Null hypothesis, Alternative hypothesis, Show answer (output table/summary table), and Conclusion based on the P value.arrow_forwardA company found that the daily sales revenue of its flagship product follows a normal distribution with a mean of $4500 and a standard deviation of $450. The company defines a "high-sales day" that is, any day with sales exceeding $4800. please provide a step by step on how to get the answers Q: What percentage of days can the company expect to have "high-sales days" or sales greater than $4800? Q: What is the sales revenue threshold for the bottom 10% of days? (please note that 10% refers to the probability/area under bell curve towards the lower tail of bell curve) Provide answers in the yellow cellsarrow_forwardBusiness Discussarrow_forward
- The following data represent total ventilation measured in liters of air per minute per square meter of body area for two independent (and randomly chosen) samples. Analyze these data using the appropriate non-parametric hypothesis testarrow_forwardeach column represents before & after measurements on the same individual. Analyze with the appropriate non-parametric hypothesis test for a paired design.arrow_forwardShould you be confident in applying your regression equation to estimate the heart rate of a python at 35°C? Why or why not?arrow_forward
 Functions and Change: A Modeling Approach to Coll...AlgebraISBN:9781337111348Author:Bruce Crauder, Benny Evans, Alan NoellPublisher:Cengage Learning
 Glencoe Algebra 1, Student Edition, 9780079039897...AlgebraISBN:9780079039897Author:CarterPublisher:McGraw Hill
 College Algebra (MindTap Course List)AlgebraISBN:9781305652231Author:R. David Gustafson, Jeff HughesPublisher:Cengage Learning
 Big Ideas Math A Bridge To Success Algebra 1: Stu...AlgebraISBN:9781680331141Author:HOUGHTON MIFFLIN HARCOURTPublisher:Houghton Mifflin Harcourt