Concept explainers
Videos
A.
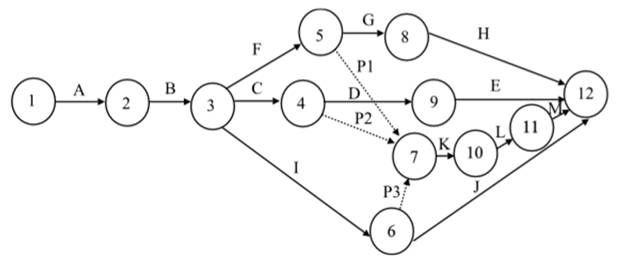
Interpretation: A network diagram representing the activities of the project is to be constructed.
Concept Introduction: Network diagram is a graphical representation of tasks and events happening in a project. It depicts the work flow and is used to compute the total duration of the project.
A.
Explanation of Solution
Given information: Theactivities to be taken up for the construction of a gas station and the time duration for each are given in the table.
| Activity | Time |
| A | 4 |
| B | 2 |
| C | 3 |
| D | 1 |
| E | 1 |
| F | 2 |
| G | 3 |
| H | 1 |
| I | 5 |
| J | 3 |
| K | 4 |
| L | 2 |
| M | 1 |
The activity times and the precedence relationship are shown in the table:
| Activity | Time | Predecessors |
| A | 4 | |
| B | 2 | A |
| C | 3 | B |
| D | 1 | C |
| E | 1 | D |
| F | 2 | B |
| G | 3 | F |
| H | 1 | G |
| I | 5 | B |
| J | 3 | I |
| K | 4 | C, F, I |
| L | 2 | K |
| M | 1 | L |
The network diagram showing the work flows is as follows:
B.
Interpretation: The critical path is to be identified by computing the earliest and the latest start and finish times.
Concept Introduction: Network diagram is a graphical representation of tasks and events happening in a project. It depicts the work flow and is used to compute the total duration of the project.
B.
Answer to Problem 26AP
The critical path is A − B − I − K − L − M with completion time as 18 weeks
Explanation of Solution
Given information:
| Activity | Time |
| A | 4 |
| B | 2 |
| C | 3 |
| D | 1 |
| E | 1 |
| F | 2 |
| G | 3 |
| H | 1 |
| I | 5 |
| J | 3 |
| K | 4 |
| L | 2 |
| M | 1 |

The earliest and latest start and finish times are calculated using the formulae:
Earliest Start (EST) = Maximum EFT of the predecessor activity
Latest Start (LST) = LFT - Duration
Earliest Finish (EFT) = EST + Duration
Latest Finish (LFT) = Minimum LST of the immediate successor
Slack = LFT − EFT (or) LST − EST
| Activity | Time | EST | EFT | LST | LFT | Slack |
| A | 4 | 0 | 4 | 0 | 4 | 0 |
| B | 2 | 4 | 6 | 4 | 6 | 0 |
| C | 3 | 6 | 9 | 8 | 11 | 2 |
| D | 1 | 9 | 10 | 16 | 17 | 7 |
| E | 1 | 10 | 11 | 17 | 18 | 7 |
| F | 2 | 6 | 8 | 9 | 11 | 3 |
| G | 3 | 8 | 11 | 14 | 17 | 6 |
| H | 1 | 11 | 12 | 17 | 18 | 6 |
| I | 5 | 6 | 11 | 6 | 11 | 0 |
| J | 3 | 11 | 14 | 15 | 18 | 4 |
| K | 4 | 11 | 15 | 11 | 15 | 0 |
| L | 2 | 15 | 17 | 15 | 17 | 0 |
| M | 1 | 17 | 18 | 17 | 18 | 0 |
The critical path includes the activities with zero slack. So, here the critical path is A − B− I − K − L − M. The total time taken to complete the project is 18 weeks.
C.
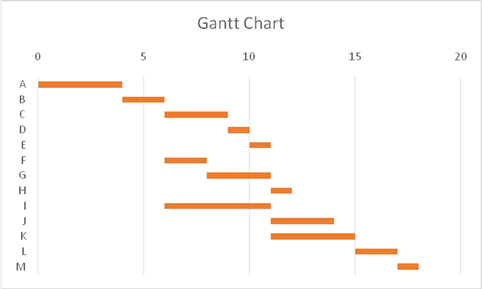
Interpretation: A Gantt chart of the
Concept Introduction: Gantt chart is a project management tool that is a type of bar chart. It depicts the project schedule and is used for resource allocation.
C.
Answer to Problem 26AP
A Gantt chart for the project has been drawn.
Explanation of Solution
Given information:
| Activity | Time |
| A | 4 |
| B | 2 |
| C | 3 |
| D | 1 |
| E | 1 |
| F | 2 |
| G | 3 |
| H | 1 |
| I | 5 |
| J | 3 |
| K | 4 |
| L | 2 |
| M | 1 |
Activity times and early start times:
| Activity | EST | Time |
| A | 0 | 4 |
| B | 4 | 2 |
| C | 6 | 3 |
| D | 9 | 1 |
| E | 10 | 1 |
| F | 6 | 2 |
| G | 8 | 3 |
| H | 11 | 1 |
| I | 6 | 5 |
| J | 11 | 3 |
| K | 11 | 4 |
| L | 15 | 2 |
| M | 17 | 1 |
The Gantt chart depicting the project based on the EST:
D.
Interpretation: The impact of replacement of the air compressor which takes two weeks on the completion of the project is to be determined.
Concept Introduction: Network diagram is a graphical representation of tasks and events happening in a project. It depicts the work flow and is used to compute the total duration of the project.
D.
Explanation of Solution
Given information:
| Activity | Time |
| A | 4 |
| B | 2 |
| C | 3 |
| D | 1 |
| E | 1 |
| F | 2 |
| G | 3 |
| H | 1 |
| I | 5 |
| J | 3 |
| K | 4 |
| L | 2 |
| M | 1 |
Installing the air compressor is represented by activity G.
| Activity | Time | EST | EFT | LST | LFT | Slack |
| A | 4 | 0 | 4 | 0 | 4 | 0 |
| B | 2 | 4 | 6 | 4 | 6 | 0 |
| C | 3 | 6 | 9 | 8 | 11 | 2 |
| D | 1 | 9 | 10 | 16 | 17 | 7 |
| E | 1 | 10 | 11 | 17 | 18 | 7 |
| F | 2 | 6 | 8 | 9 | 11 | 3 |
| G | 3 | 8 | 11 | 14 | 17 | 6 |
| H | 1 | 11 | 12 | 17 | 18 | 6 |
| I | 5 | 6 | 11 | 6 | 11 | 0 |
| J | 3 | 11 | 14 | 15 | 18 | 4 |
| K | 4 | 11 | 15 | 11 | 15 | 0 |
| L | 2 | 15 | 17 | 15 | 17 | 0 |
| M | 1 | 17 | 18 | 17 | 18 | 0 |
The latest start time of the activity G is 14th week. If the failure is identified before installation, the project will not be delayed as the replacement time (2 weeks) is less than the slack (6 weeks).
If the failure is found during testing of the air compressor, represented by activity H, still the project would not be delayed, as again there is a slack of 6 weeks.
E.
Interpretation: The activities that can be completed by the end of the 15th week without delaying the project completion are to be determined.
Concept Introduction: Network diagram is a graphical representation of tasks and events happening in a project. It depicts the work flow and is used to compute the total duration of the project.
E.
Answer to Problem 26AP
The activities A, B, C, F and I have to be completed by the end of the 15th week to guarantee project completion without delay.
Explanation of Solution
Given information:
| Activity | Time |
| A | 4 |
| B | 2 |
| C | 3 |
| D | 1 |
| E | 1 |
| F | 2 |
| G | 3 |
| H | 1 |
| I | 5 |
| J | 3 |
| K | 4 |
| L | 2 |
| M | 1 |
The table shows the Earliest and Latest times of the activities
| Activity | Time | EST | EFT | LST | LFT | Slack |
| A | 4 | 0 | 4 | 0 | 4 | 0 |
| B | 2 | 4 | 6 | 4 | 6 | 0 |
| C | 3 | 6 | 9 | 8 | 11 | 2 |
| D | 1 | 9 | 10 | 16 | 17 | 7 |
| E | 1 | 10 | 11 | 17 | 18 | 7 |
| F | 2 | 6 | 8 | 9 | 11 | 3 |
| G | 3 | 8 | 11 | 14 | 17 | 6 |
| H | 1 | 11 | 12 | 17 | 18 | 6 |
| I | 5 | 6 | 11 | 6 | 11 | 0 |
| J | 3 | 11 | 14 | 15 | 18 | 4 |
| K | 4 | 11 | 15 | 11 | 15 | 0 |
| L | 2 | 15 | 17 | 15 | 17 | 0 |
| M | 1 | 17 | 18 | 17 | 18 | 0 |
The latest finish times of the activities A, B, C, F and Iam less than 15 weeks. Therefore, these activities have to be completed by the end of the 15th weeks to guarantee project completion without any delay.
F.
Interpretation: The optimal solution for the problem is to be determined using linear programming.
Concept Introduction: Linear programming is a mathematical technique used to achieve the best outcome, given a list of parameters usually restrictions on the resources.
F.
Answer to Problem 26AP
The optimal solution for the problem is obtained using linear programming.
Explanation of Solution
Given information:
| Activity | Time |
| A | 4 |
| B | 2 |
| C | 3 |
| D | 1 |
| E | 1 |
| F | 2 |
| G | 3 |
| H | 1 |
| I | 5 |
| J | 3 |
| K | 4 |
| L | 2 |
| M | 1 |
The various paths of the project and the durations are:
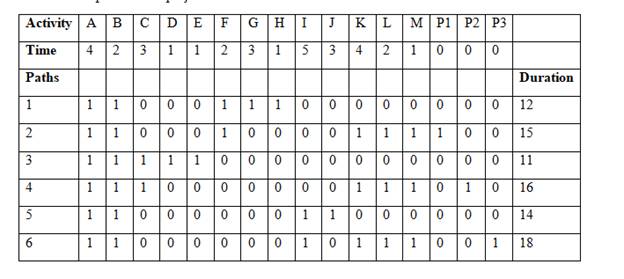
The critical path is A − B − I − K − L − M with the completion time of 18 weeks.
Using linear programming, the EST is calculated.
Objective function = =SUM (B2:M2)
| Nodes | 1 | 2 | 3 | 4 | 5 | 6 | 7 | 8 | 9 | 10 | 11 | 12 |
| EST |
The constraints
| Activity | Time | ||
| A | 0 | > | 4 |
| B | 0 | > | 2 |
| C | 0 | > | 3 |
| D | 0 | > | 1 |
| E | 0 | > | 1 |
| F | 0 | > | 2 |
| G | 0 | > | 3 |
| H | 0 | > | 1 |
| I | 0 | > | 5 |
| J | 0 | > | 3 |
| K | 0 | > | 4 |
| L | 0 | > | 2 |
| M | 0 | > | 1 |
| P1 | 0 | > | 0 |
| P2 | 0 | > | 0 |
| P3 | 0 | > | 0 |
Solver Solution:
| Objective Function |
| 120 |
EST for the nodes:
| Nodes | 1 | 2 | 3 | 4 | 5 | 6 | 7 | 8 | 9 | 10 | 11 | 12 |
| EST | 0 | 4 | 6 | 9 | 8 | 11 | 11 | 11 | 10 | 15 | 17 | 18 |
Want to see more full solutions like this?
Chapter 10 Solutions
EBK PRODUCTION AND OPERATIONS ANALYSIS


- How can mindfulness be combined with cognitive reframing to build emotional regulation and mental flexibility? What is the strategy for maintaining mental well-being to improve through deliberate practice? How to engage in practices that help regulate emotions and build resilience?arrow_forward• We Are HIRING Salesforce Developer (2 - 4 Years) @ Cloudodyssey It Solutions Requirement : Appropriate knowledge on Salesforce standard objects Leads, Account, Contacts, Opportunity, Products, Lead process, Sales process, is required. • Hands-on experience in Salesforce Experience Cloud, Sales Cloud and Lightning. • • Hands experience with Salesforce development, administration, system integrations, Lightning Design System, and bug fixes. Experience in configuration, integration, APIs creation, testing and deployment of Salesforce.com functionality. Eloquent verbal and written communication skills. • Familiar with Agile framework. Work Location: Bangalore SUBMIT YOUR CV hello@cloudodyssey.coarrow_forwardAgree or disagree with post On the surface, the numbers in financial statements do present a snapshot of a company's financial position and performance. However, just looking at the raw numbers often doesn't tell the whole story or reveal underlying trends and relationships that are crucial for making informed decisions. Think of it like looking at individual pieces of a puzzle. Each number is a piece, providing some information. But to see the complete picture – the company's overall financial health, its performance over time, how it compares to its peers, and its potential future – you need to assemble those pieces using different analytical tools. For example: Horizontal analysis helps us understand how specific financial statement items have changed over multiple periods. Is revenue growing? Are expenses increasing at a faster rate than sales? This reveals trends that a single year's numbers wouldn't show. Vertical analysis allows us to see the relative size of each item within…arrow_forward
- What can you do in response to an insulting offer?arrow_forwardAgree or disagree with post If someone hits you with an insulting offer, the first thing to do is not take it personally. It’s normal to feel a little offended, but blowing up or shutting down won’t help your case. Better move is to stay calm and treat it like a misunderstanding or just the first step in the conversation. That way, you keep things respectful but still let them know the offer doesn’t sit right with you. It also helps to back up your response with facts. Bring in things like your experience, numbers, or any specific results you delivered. That can shift the conversation away from feelings and toward the value you bring. Agree or disagree with postarrow_forwardAgree or disagree with the post When you get an insulting offer, the best thing to do is stay calm and professional. Try not to take it personally or react out of anger. Instead, ask questions to understand why the offer was so low. This helps you get a better idea of what the other person is thinking. After that, you can respond with a counteroffer that shows your value. Use simple facts like your skills, experience, and what others in your field are getting paid to back up your request. If the person still refuses to offer something fair, it’s okay to politely say no and walk away. Standing up for yourself in a respectful way shows confidence and helps others take you seriously. Agree or disagree with the postarrow_forward
- Regarding perceptions that can occur when negotiating in different places and at different times, the continuation norm in e-negotiations is best described as _____. Group of answer choices A. negotiators' beliefs that negotiations are worth continuing B. the act of thinking about how things might have turned out differently C. the tendency for e-communicators to ascribe diabolical intentions to the other party D. the tendency for negotiators to behave as if they are communicating synchronously when in fact they are notarrow_forwardIn any discussion or meeting, there is a tendency for a minority of people to do most of the talking. A key determinant of who dominates the conversation is _____. Group of answer choices A. their status within the group B. their network of social connections C. their gender D. their agearrow_forwardWith regard to intergenerational negotiation, the _____ generation has vast numbers of relationships but few of them are deep. They spend more time communicating virtually than face-to-face. Their personal and work networks are vital to their on-the-fly learning and problem-solving skills. Armed with tools for working anywhere at any time, this generation puts more value in leading a balanced life and flexibility with their work and life demands. Group of answer choices A. mature B. boomer C. millennial D. Generation Xarrow_forward
- If a negotiator has less power than the counterparty and an unattractive BATNA, which communication medium might help the less-powerful negotiator claim more resources?arrow_forwardCould you help explain what the foundations of faith are? What are their strategies?arrow_forwardHi! Can you guys help me with this? Thank you! Please write-up summarizing the core message of the movie/documentary and the connection to the course material The documentary is Poisoned: The Dirty Truth About Your Food directed by Stephanie Soechtig from Netflix. * Here are the course material: Global Logistics Global Transportation; Global Inventory Management Global Operation Global Market Channels Purchasing Stategies: Outsourcing; Offshoring; Nearshoring; Multi-sourcing & Co-sourcing Make or Buy decisions Global Supply Chain Infrastructure: Transportation Infrastructure; Communication Infrastructure; Utilities Infrastructure; Technology Infrastructure Supply Chain Risks: • Supply Risks – disruption of supply, inventory and schedules. • Operational Risks – breakdown of operations, changes in technologies. • Demand Risks – variations in demand.• Security Risks – theft, sabotage, terrorism, counterfeiting.• Macro Risks – economic shifts, recession, wage hikes, varying…arrow_forward
 Practical Management ScienceOperations ManagementISBN:9781337406659Author:WINSTON, Wayne L.Publisher:Cengage,
 Purchasing and Supply Chain ManagementOperations ManagementISBN:9781285869681Author:Robert M. Monczka, Robert B. Handfield, Larry C. Giunipero, James L. PattersonPublisher:Cengage Learning