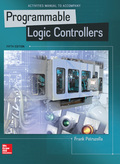
EBK ACTIVITIES MANUAL FOR PROGRAMMABLE
5th Edition
ISBN: 8220102795983
Author: Petruzella
Publisher: YUZU
expand_more
expand_more
format_list_bulleted
Question
Chapter 10, Problem 20RQ
Program Plan Intro
Programmable Logic Controller (PLC):
- PLC is a specialized computer used in industrial segments to control machines and process.
- PLC is program that consists of a set of instructions which resembles the controlling functions needed to perform specific tasks.
- The function of PLC is similar to that of a relay and hence, in an industrial segment a relay is greatly replaced by a suitable PLC.
- When compared to general Personal Computer (PC), a PLC is available in small and tiny sizes.
- The basic architecture of a PLC consists of an input-output interface module and a small Central Processing Unit (CPU) that runs by controlling
programming language.
Set-point:
- Set-point is a component of closed-loop control system and abbreviated as SP.
- It refers to the input which determines the operating point for the process.
- In industrial systems, the determined set point can be limited by physical or process restraints.
Expert Solution & Answer
Want to see the full answer?
Check out a sample textbook solution
Students have asked these similar questions
The Horse table has the following columns:
ID - integer, auto increment, primary key
RegisteredName - variable-length string
Breed - variable-length string
Height - decimal number
BirthDate - date
Delete the following rows:
Horse with ID 5
All horses with breed Holsteiner or Paint
All horses born before March 13, 2013
To confirm that the deletes are correct, add the SELECT * FROM HORSE; statement.
Why is Linux popular? What would make someone choose a Linux OS over others? What makes a server? How is a server different from a workstation? What considerations do you have to keep in mind when choosing between physical, hybrid, or virtual server and what are the reasons to choose a virtual installation over the other options?
Objective you will:
1. Implement a Binary Search Tree (BST) from scratch, including the Big Five (Rule of Five)
2. Implement the TreeSort algorithm using a in-order traversal to store sorted elements in a vector.
3. Compare the performance of TreeSort with C++'s std::sort on large datasets.
Part 1: Understanding TreeSort How TreeSort Works TreeSort is a comparison-based sorting algorithm that leverages a Binary Search Tree (BST):
1. Insert all elements into a BST (logically sorting them).
2. Traverse the BST in-order to extract elements in sorted order.
3. Store the sorted elements in a vector.
Time Complexity
Operation Average Case Worst Case (Unbalanced Tree)Insertion 0(1log n) 0 (n)Traversal (Pre-order) 0(n) 0 (n)Overall Complexity 0(n log n) 0(n^2) (degenerated tree)
Note: To improve performance, you could use a…
Chapter 10 Solutions
EBK ACTIVITIES MANUAL FOR PROGRAMMABLE
Ch. 10 - In general, what do data manipulation instructions...Ch. 10 - Prob. 2RQCh. 10 - Prob. 3RQCh. 10 - Prob. 4RQCh. 10 - Prob. 5RQCh. 10 - Prob. 6RQCh. 10 - Prob. 7RQCh. 10 - Prob. 8RQCh. 10 - Prob. 9RQCh. 10 - Prob. 10RQ
Ch. 10 - Prob. 11RQCh. 10 - Prob. 12RQCh. 10 - Prob. 13RQCh. 10 - Prob. 14RQCh. 10 - Prob. 15RQCh. 10 - Prob. 16RQCh. 10 - Prob. 17RQCh. 10 - Prob. 18RQCh. 10 - Prob. 19RQCh. 10 - Prob. 20RQCh. 10 - Prob. 21RQCh. 10 - Prob. 22RQCh. 10 - Prob. 1PCh. 10 - Prob. 2PCh. 10 - Prob. 3PCh. 10 - Prob. 4PCh. 10 - Prob. 7PCh. 10 - Prob. 8PCh. 10 - Prob. 9PCh. 10 - Prob. 10PCh. 10 - Write a program that will cause a light to come on...Ch. 10 - Write a program that will cause a light to come on...
Knowledge Booster
Similar questions
- I need help fixing the minor issue where the text isn't in the proper place, and to ensure that the frequency cutoff is at the right place. My code: % Define frequency range for the plot f = logspace(1, 5, 500); % Frequency range from 10 Hz to 100 kHz w = 2 * pi * f; % Angular frequency % Parameters for the filters - let's adjust these to get more reasonable cutoffs R = 1e3; % Resistance in ohms (1 kΩ) C = 1e-6; % Capacitance in farads (1 μF) % For bandpass, we need appropriate L value for desired cutoffs L = 0.1; % Inductance in henries - adjusted for better bandpass response % Calculate cutoff frequencies first to verify they're in desired range f_cutoff_RC = 1 / (2 * pi * R * C); f_resonance = 1 / (2 * pi * sqrt(L * C)); Q_factor = (1/R) * sqrt(L/C); f_lower_cutoff = f_resonance / (sqrt(1 + 1/(4*Q_factor^2)) + 1/(2*Q_factor)); f_upper_cutoff = f_resonance / (sqrt(1 + 1/(4*Q_factor^2)) - 1/(2*Q_factor)); % Transfer functions % Low-pass filter (RC) H_low = 1 ./ (1 + 1i * w *…arrow_forwardMy code is experincing minor issue where the text isn't in the proper place, and to ensure that the frequency cutoff is at the right place. My code: % Define frequency range for the plot f = logspace(1, 5, 500); % Frequency range from 10 Hz to 100 kHz w = 2 * pi * f; % Angular frequency % Parameters for the filters - let's adjust these to get more reasonable cutoffs R = 1e3; % Resistance in ohms (1 kΩ) C = 1e-6; % Capacitance in farads (1 μF) % For bandpass, we need appropriate L value for desired cutoffs L = 0.1; % Inductance in henries - adjusted for better bandpass response % Calculate cutoff frequencies first to verify they're in desired range f_cutoff_RC = 1 / (2 * pi * R * C); f_resonance = 1 / (2 * pi * sqrt(L * C)); Q_factor = (1/R) * sqrt(L/C); f_lower_cutoff = f_resonance / (sqrt(1 + 1/(4*Q_factor^2)) + 1/(2*Q_factor)); f_upper_cutoff = f_resonance / (sqrt(1 + 1/(4*Q_factor^2)) - 1/(2*Q_factor)); % Transfer functions % Low-pass filter (RC) H_low = 1 ./ (1 + 1i * w *…arrow_forwardI would like to know the main features about the following three concepts: 1. Default forwarded 2. WINS Server 3. IP Security (IPSec).arrow_forward
- map the following ER diagram into a relational database schema diagram. you should take into account all the constraints in the ER diagram. Underline the primary key of each relation, and show each foreign key as a directed arrow from the referencing attributes (s) to the referenced relation. NOTE: Need relational database schema diagramarrow_forwardWhat is business intelligence? Share the Business intelligence (BI) tools you have used and explain what types of decisions you made.arrow_forwardI need help fixing the minor issue where the text isn't in the proper place, and to ensure that the frequency cutoff is at the right place. My code: % Define frequency range for the plot f = logspace(1, 5, 500); % Frequency range from 10 Hz to 100 kHz w = 2 * pi * f; % Angular frequency % Parameters for the filters - let's adjust these to get more reasonable cutoffs R = 1e3; % Resistance in ohms (1 kΩ) C = 1e-6; % Capacitance in farads (1 μF) % For bandpass, we need appropriate L value for desired cutoffs L = 0.1; % Inductance in henries - adjusted for better bandpass response % Calculate cutoff frequencies first to verify they're in desired range f_cutoff_RC = 1 / (2 * pi * R * C); f_resonance = 1 / (2 * pi * sqrt(L * C)); Q_factor = (1/R) * sqrt(L/C); f_lower_cutoff = f_resonance / (sqrt(1 + 1/(4*Q_factor^2)) + 1/(2*Q_factor)); f_upper_cutoff = f_resonance / (sqrt(1 + 1/(4*Q_factor^2)) - 1/(2*Q_factor)); % Transfer functions % Low-pass filter (RC) H_low = 1 ./ (1 + 1i * w *…arrow_forward
- Task 3. i) Compare your results from Tasks 1 and 2. j) Repeat Tasks 1 and 2 for 500 and 5,000 elements. k) Summarize run-time results in the following table: Time/size n String StringBuilder 50 500 5,000arrow_forwardCan you please solve this without AIarrow_forward1. Create a Vehicle.java file. Implement the public Vehicle and Car classes in Vehicle.java, including all the variables and methods in the UMLS. Vehicle - make: String model: String -year: int + Vehicle(String make, String, model, int, year) + getMake(): String + setMake(String make): void + getModel(): String + setModel(String model): void + getYear(): int + set Year(int year): void +toString(): String Car - numDoors: int + numberOfCar: int + Car(String make, String, model, int, year, int numDoors) + getNumDoors(): int + setNumDoors (int num Doors): void + toString(): String 2. Create a CarTest.java file. Implement a public CarTest class with a main method. In the main method, create one Car object and print the object using System.out.println(). Then, print the numberOfCar. Your printing result must follow the example output: make Toyota, model=Camry, year=2022 numDoors=4 1 Hint: You need to modify the toString methods in the Car class and Vehicle class!arrow_forward
- CHATGPT GAVE ME WRONG ANSWER PLEASE HELParrow_forwardHELP CHAT GPT GAVE ME WRONG ANSWER Consider the following implementation of a container that will be used in a concurrent environment. The container is supposed to be used like an indexed array, but provide thread-safe access to elements. struct concurrent_container { // Assume it’s called for any new instance soon before it’s ever used void concurrent_container() { init_mutex(&lock); } ~concurrent_container() { destroy_mutex(&lock); } // Returns element by its index. int get(int index) { lock.acquire(); if (index < 0 || index >= size) { return -1; } int result = data[index]; lock.release(); return result; } // Sets element by its index. void set(int index, int value) { lock.acquire(); if (index < 0 || index >= size) { resize(size); } data[index] = value; lock.release(); } // Extend maximum capacity of the…arrow_forwardWrite a C program using embedded assembler in which you use your own function to multiply by two without using the product. Tip: Just remember that multiplying by two in binary means shifting the number one place to the left. You can use the sample program from the previous exercise as a basis, which increments a variable. Just replace the INC instruction with SHL.arrow_forward
arrow_back_ios
SEE MORE QUESTIONS
arrow_forward_ios
Recommended textbooks for you
 Systems ArchitectureComputer ScienceISBN:9781305080195Author:Stephen D. BurdPublisher:Cengage Learning
 Principles of Information Systems (MindTap Course...Computer ScienceISBN:9781305971776Author:Ralph Stair, George ReynoldsPublisher:Cengage LearningProgramming Logic & Design ComprehensiveComputer ScienceISBN:9781337669405Author:FARRELLPublisher:Cengage
 Enhanced Discovering Computers 2017 (Shelly Cashm...Computer ScienceISBN:9781305657458Author:Misty E. Vermaat, Susan L. Sebok, Steven M. Freund, Mark Frydenberg, Jennifer T. CampbellPublisher:Cengage Learning
 Fundamentals of Information SystemsComputer ScienceISBN:9781305082168Author:Ralph Stair, George ReynoldsPublisher:Cengage Learning
 A+ Guide to Hardware (Standalone Book) (MindTap C...Computer ScienceISBN:9781305266452Author:Jean AndrewsPublisher:Cengage Learning

Systems Architecture
Computer Science
ISBN:9781305080195
Author:Stephen D. Burd
Publisher:Cengage Learning

Principles of Information Systems (MindTap Course...
Computer Science
ISBN:9781305971776
Author:Ralph Stair, George Reynolds
Publisher:Cengage Learning

Programming Logic & Design Comprehensive
Computer Science
ISBN:9781337669405
Author:FARRELL
Publisher:Cengage

Enhanced Discovering Computers 2017 (Shelly Cashm...
Computer Science
ISBN:9781305657458
Author:Misty E. Vermaat, Susan L. Sebok, Steven M. Freund, Mark Frydenberg, Jennifer T. Campbell
Publisher:Cengage Learning

Fundamentals of Information Systems
Computer Science
ISBN:9781305082168
Author:Ralph Stair, George Reynolds
Publisher:Cengage Learning

A+ Guide to Hardware (Standalone Book) (MindTap C...
Computer Science
ISBN:9781305266452
Author:Jean Andrews
Publisher:Cengage Learning