
Concept explainers
a)
To determine: The mean of each sample.
a)
Answer to Problem 20P
Explanation of Solution
Given information:
| Sample | |||
| 1 | 2 | 3 | 4 |
| 4.5 | 4.6 | 4.5 | 4.7 |
| 4.2 | 4.5 | 4.6 | 4.6 |
| 4.2 | 4.4 | 4.4 | 4.8 |
| 4.3 | 4.7 | 4.4 | 4.5 |
| 4.3 | 4.3 | 4.6 | 4.9 |
Calculation of mean of each sample:
| Sample | ||||
| Sl. No. | 1 | 2 | 3 | 4 |
| 1 | 4.5 | 4.6 | 4.5 | 4.7 |
| 2 | 4.2 | 4.5 | 4.6 | 4.6 |
| 3 | 4.2 | 4.4 | 4.4 | 4.8 |
| 4 | 4.3 | 4.7 | 4.4 | 4.5 |
| 5 | 4.3 | 4.3 | 4.6 | 4.9 |
| Mean | 4.3 | 4.5 | 4.5 | 4.7 |
Table 1
Excel Worksheet:
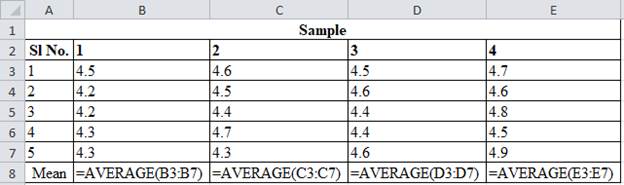
Sample 1:
The mean is calculated by adding each sample points. Adding the points 4.5, 4.2, 4.2, 4.3 and 4.3 and dividing by 5 gives mean of 4.3. The same process is followed for finding mean for other samples.
Hence, the mean of each sample is shown in Table 1
b)
To determine: The mean and standard deviation when the process parameters are unknown.
b)
Answer to Problem 20P
Explanation of Solution
Given information:
| Sample | |||
| 1 | 2 | 3 | 4 |
| 4.5 | 4.6 | 4.5 | 4.7 |
| 4.2 | 4.5 | 4.6 | 4.6 |
| 4.2 | 4.4 | 4.4 | 4.8 |
| 4.3 | 4.7 | 4.4 | 4.5 |
| 4.3 | 4.3 | 4.6 | 4.9 |
Calculation of mean and standard deviation:
Table 1 provides the mean for each sample points.
The mean is calculated by adding each mean of the samples. Adding the points 4.3, 4.5, 4.5 and 4.7 and dividing by 4 gives mean of 4.5.
The standard deviation is calculated using the above formula and substituting the values of mean in the above formula and the resultant of 0.192 is obtained.
Hence, the mean and standard deviation when the process parameters are unknown are 4.5 and 0.192.
c)
To determine: The mean and standard deviation of the sampling distribution.
c)
Answer to Problem 20P
Explanation of Solution
Given information:
| Sample | |||
| 1 | 2 | 3 | 4 |
| 4.5 | 4.6 | 4.5 | 4.7 |
| 4.2 | 4.5 | 4.6 | 4.6 |
| 4.2 | 4.4 | 4.4 | 4.8 |
| 4.3 | 4.7 | 4.4 | 4.5 |
| 4.3 | 4.3 | 4.6 | 4.9 |
Calculation of mean and standard deviation of the sampling distribution:
From calculation of mean of each samples, the mean for sampling distribution can be computed, the mean for sampling distribution is 4.5 (refer equation (1)).
The standard deviation of the sampling distribution is calculated by dividing 0.192 with the square root of 5 which gives the resultant as 0.086.
Hence, the mean and standard deviation of the sampling distribution is 4.5 and 0.086 respectively.
d)
To determine: The three-sigma control limit for the process and alpha risk provided by them.
d)
Answer to Problem 20P
Explanation of Solution
Given information:
| Sample | |||
| 1 | 2 | 3 | 4 |
| 4.5 | 4.6 | 4.5 | 4.7 |
| 4.2 | 4.5 | 4.6 | 4.6 |
| 4.2 | 4.4 | 4.4 | 4.8 |
| 4.3 | 4.7 | 4.4 | 4.5 |
| 4.3 | 4.3 | 4.6 | 4.9 |
Calculation of three-sigma control limit for the process:
The three-sigma control limits for the process is calculated by multiplying 3.00 with 0.086 (refer equation (2)) and the resultant is added with 4.5 to get an upper control limit which is 4.758 and subtracted to get lower control limit which is 4.242. Using z-factor table z = +3.00 corresponds to 0.4987.
The alpha risk is calculated to be as 0.0026.
Hence, the three-sigma control limits for the process are 4.758 and 4.242.
e)
To determine: The alpha risk for control limits of 4.14 and 4.86.
e)
Answer to Problem 20P
Explanation of Solution
Given information:
| Sample | |||
| 1 | 2 | 3 | 4 |
| 4.5 | 4.6 | 4.5 | 4.7 |
| 4.2 | 4.5 | 4.6 | 4.6 |
| 4.2 | 4.4 | 4.4 | 4.8 |
| 4.3 | 4.7 | 4.4 | 4.5 |
| 4.3 | 4.3 | 4.6 | 4.9 |
Formula:
Calculation alpha risk for control limits of 4.14 and 4.86:
The alpha risk is calculated by dividing the difference of 4.86 and 4.5 with 0.086 which gives +4.19 which is the risk is close to zero.
Hence, the alpha risk for control limits of 4.14 and 4.86 is +4.1
f)
To determine: Whether any of the sample means are beyond the control limits.
f)
Answer to Problem 20P
Explanation of Solution
Given information:
| Sample | |||
| 1 | 2 | 3 | 4 |
| 4.5 | 4.6 | 4.5 | 4.7 |
| 4.2 | 4.5 | 4.6 | 4.6 |
| 4.2 | 4.4 | 4.4 | 4.8 |
| 4.3 | 4.7 | 4.4 | 4.5 |
| 4.3 | 4.3 | 4.6 | 4.9 |
Determination of whether any of the sample means are beyond the control limits:
Table 1 provides the sample means for each sample. From observation, it can be found that each sample mean are within the control limit of 4.14 and 4.86. Therefore, each sample means lies within the control limits of 4.14 and 4.86.
Hence, there are no sample means which lies beyond the control limits.
g)
To determine: Whether any of the samples are beyond the control limits.
g)
Answer to Problem 20P
Explanation of Solution
Given information:
| SAMPLE | |||
| 1 | 2 | 3 | 4 |
| 4.5 | 4.6 | 4.5 | 4.7 |
| 4.2 | 4.5 | 4.6 | 4.6 |
| 4.2 | 4.4 | 4.4 | 4.8 |
| 4.3 | 4.7 | 4.4 | 4.5 |
| 4.3 | 4.3 | 4.6 | 4.9 |
Formula:
Mean Chart:
Range Chart:
Calculation of upper and lower control limits:
| SAMPLE | ||||
| 1 | 2 | 3 | 4 | |
| 4.5 | 4.6 | 4.5 | 4.7 | |
| 4.2 | 4.5 | 4.6 | 4.6 | |
| 4.2 | 4.4 | 4.4 | 4.8 | |
| 4.3 | 4.7 | 4.4 | 4.5 | |
| 4.3 | 4.3 | 4.6 | 4.9 | |
| Mean | 4.3 | 4.5 | 4.5 | 4.7 |
| Range | .3 | .4 | .2 | .4 |
From factors of three-sigma chart, A2 = 0.58; D3 = 0; D4 = 2.11.
Mean control chart:
Upper control limit:
The Upper control limit is calculated by adding the product of 0.58 and 0.325 with 4.5 which yields 4.689.
Lower control limit:
The Lower control limit is calculated by subtracting the product of 0.58 and 0.325 with 4.5 which yields 4.311.
The UCL and LCL for mean charts are 4.686 and 4.311. (4)
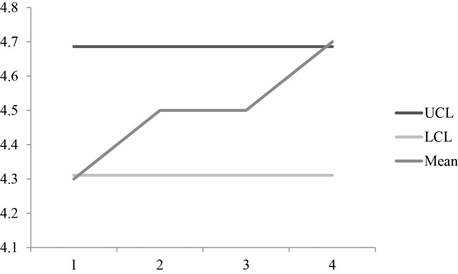
A graph is plotted using the UCL and LCL and mean values which shows the points are within the control limits.
Range control chart:
Upper control limit:
The Upper control limit is calculated by multiplying 2.11 with 0.325 which yields 0.686.
Lower control limit:
The lower control limit is calculated by multiplying 0 with 0.325 which yields 0.0.
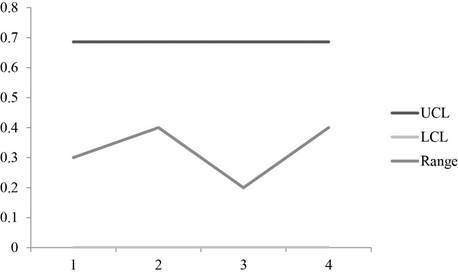
A graph is plotted using the UCL, LCL and Range values which shows that the points are within the control region.
Hence, all points are within control limits.
h)
To explain: The reason for variations in control limits.
h)
Answer to Problem 20P
Explanation of Solution
Reason for variations in control limits:
The control limits vary because in equation (3) and (4) because of the use of different measure for dispersion to measure the standard deviation and range.
Hence, the difference arises due to the use of different measures for dispersion to the measure the standard deviation and range.
i)
To determine: The control limits for the process and whether the process will be in control.
i)
Answer to Problem 20P
Explanation of Solution
Given information:
Determination of control limits of the process:
Sample mean is given in Table 1.
To calculate the control limits 0.18 is divided by root of 5 and is multiplied by 3 and the resultant is added to 4.4 to give UCL which is 4.641 and subtracted from 4.4 to get the LCL which is 4.159.
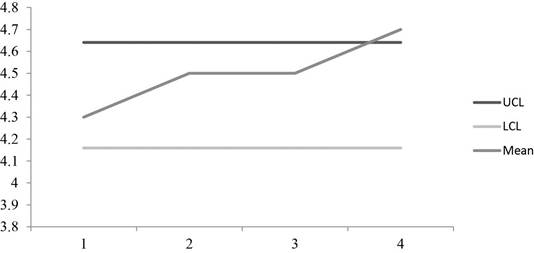
The graph shows that the some of the points are above the control limits which make the process to be out of control.
Hence, the process is out of control with UCL=4.641 and LCL=4.159.
Want to see more full solutions like this?
Chapter 10 Solutions
OPERATIONS MANAGEMENT W/ CNCT+


- what is an other difination for principle?arrow_forwardNeed help or ideas to design out two slides as my script and writing quite long to squeese into two slides. But can just point form in slides with correct title and a good script for me to present two slides in only 2.5 mins. Following is my draft, pls guide me step by step on powerpoint creation and good script to present findings. My draft: Slide 1: Foreign Labor Exploitation in Dyson's Supply Chain Introduction Dyson's former Malaysian supplier, ATA IMS Bhd, became embroiled in serious labor exploitation allegations in 2021. These concerns surfaced when whistleblowers exposed unethical labor practices affecting migrant workers, primarily from Nepal and Bangladesh. Key Forms of Exploitation Debt Bondage Due to Recruitment Fees Workers were forced to pay exorbitant recruitment fees before securing employment, often taking loans at high interest rates. This financial burden trapped them in debt bondage, leaving them with little choice but to accept exploitative working…arrow_forwardNot use ai pleasearrow_forward
- The Business Development Bank of Canada. (2023). Canadian economic outlook for 2024: Shifting into neutral. https://www.bdc.ca/en/articles-tools/blog/canadian-economic-outlook-for-2024-shifting-into-neutral “Despite persistently high inflation and rising interest rates, the news was generally better than expected for the Canadian economy in 2023” (BDC Blog 2024). Discussion Question: In your view, what are the most pressing problems for Canadian companies or consumers in 2024? Explain your answer using current examples of companies or consumer concerns.arrow_forwardhow have idividual objectives led to the current situation at TeraCog? what should Emaa do?arrow_forwardCan you write me an email about addressing an issue to mentor my supervisor the right way of deligating operations dutiesarrow_forward
- Can you right me an email about addressing an issue to mentor the right why of deligating operations dutiesarrow_forwardDefine delegation. Discuss in detail the four reasons why managers do delegation? Also statethe four main types of delegation.arrow_forwardB) Going forward, is Lean/JIT worth the risks? Should it be embraced (why?), abandoned (if so, why & what are the costs), or modified (how?) Do you think Lean works or not? Please write a complete response (about 1-2 paragraphs each part). Each team member should discuss and contribute so that the group agrees on their joint response. Please help each other and build upon and/or challenge others' points (in a respectful way!)arrow_forward
- Discuss the principle reasons that employee benefits have risen over the past 20 years, along with how best an organization can provide employees with a fair wage yet also provide some level of employee benefit coverage.arrow_forwardPlease assist with the Case Study below as attached. Read the case study below and answer the questions that follow. The Importance of the Planning Phase to Project Success. Traditional wisdom is that planning and analysis are very important and the more there is in a project, the more successful the project will be. Time spent on these activities will reduce risk and increase project success. On the other hand, inadequate analysis and planning will lead to a failed project. If poor planning has led to failed projects, then perhaps billions of dollars have been lost. But how much is too much? “Light weight” project management techniques such as agile are gaining popularity. Part of their ethos is that less initial planning is better and an evolutionary process is more efficient. QUESTION 1 The article above states: “Traditional wisdom is that planning and analysis are very important and the more there is in a project, the more successful the project will be”. Describe FIVE (5) ways…arrow_forwardOn a daily basis, the van is dispatched from Maplewood Hospital to pickup blood and platelet donations made at its local donation centers. The distances in miles between all locations may be found in the table below. Click the icon to view mileage data for Vampire Van. a. The van travels from the Hospital (A) to (B) to (C) to (D) to (E) and then returns to the Hospital (A). What is the total number of miles that the van must travel using this route? Route ABCDEA requires a total distance of 20.4 miles. (Enter your response rounded to one decimal place.) b. Using Maplewood Hospital as the beginning location, create a route using the Nearest Neighbor heuristic. What is the total number of miles that the van must travel using this route? The new route is A A and requires a total distance of miles. (Enter your response rounded to one decimal place.) More Info Maplewood City Center Westbrook Hospital (A) Donation Site (B) Donation Site (C) Municipal Park Donation Site (D) Valley Hills…arrow_forward
 Practical Management ScienceOperations ManagementISBN:9781337406659Author:WINSTON, Wayne L.Publisher:Cengage,