Concept explainers
Videos
NASDAQ 100 Stocks For Exercises 1-10, the data come from a random sample of 20 companies of the NASDAQ 100 taken on June 8, 2017. (Data from: www.morningstar.com.)
For Exercises 1 and 2, (a) write a frequency distribution; (b) draw a histogram.
The variable is the price of the stock (rounded to the nearest dollar).
| 123 | 35 | 76 | 38 |
| 45 | 62 | 50 | 111 |
| 180 | 108 | 65 | 46 |
| 66 | 100 | 64 | 144 |
| 57 | 107 | 48 | 110 |
(a)
Explanation of Solution
Given:
Consider the data came from a random sample of 20 companies of NASDAQ 100
| 123 | 35 | 76 | 38 |
| 45 | 62 | 50 | 111 |
| 180 | 108 | 65 | 46 |
| 66 | 100 | 64 | 144 |
| 57 | 107 | 48 | 110 |
Calculation:
To draw the frequency table, sort the data set
35,38,45, 46,48,50,57,62,64,65,66,76,100,107,108,110,111,123,144,180
There is no repetition of data therefore the frequency of occurrence is 1 for all the data set hence the frequency distribution is
| 35 | 1 | 66 | 1 |
| 38 | 1 | 76 | 1 |
| 45 | 1 | 100 | 1 |
| 46 | 1 | 107 | 1 |
| 48 | 1 | 108 | 1 |
| 50 | 1 | 110 | 1 |
| 57 | 1 | 111 | 1 |
| 62 | 1 | 123 | 1 |
| 64 | 1 | 144 | 1 |
| 65 | 1 | 180 | 1 |
(b)
To graph: Draw the histogram corresponding to the corresponding to the data came from a random sample of 20 companies of NASDAQ 100.
Explanation of Solution
Given:
Consider the data came from a random sample of 20 companies of NASDAQ 100
| 123 | 35 | 76 | 38 |
| 45 | 62 | 50 | 111 |
| 180 | 108 | 65 | 46 |
| 66 | 100 | 64 | 144 |
| 57 | 107 | 48 | 110 |
Calculation:
To draw the frequency table sort the data set
35,38,45, 46,48,50,57,62,64,65,66,76,100,107,108,110,111,123,144,180
There is no repetition of data therefore the frequency of occurrence is 1 for all the data set hence the frequency distribution is
| 35 | 1 | 66 | 1 |
| 38 | 1 | 76 | 1 |
| 45 | 1 | 100 | 1 |
| 46 | 1 | 107 | 1 |
| 48 | 1 | 108 | 1 |
| 50 | 1 | 110 | 1 |
| 57 | 1 | 111 | 1 |
| 62 | 1 | 123 | 1 |
| 64 | 1 | 144 | 1 |
| 65 | 1 | 180 | 1 |
| Range | Frequency |
| 20-40 | 2 |
| 40-60 | 5 |
| 60-80 | 5 |
| 80-100 | 0 |
| 100-120 | 5 |
| 120-140 | 1 |
| 140-160 | 1 |
| 160-180 | 0 |
| 180-200 | 1 |
The y-axis represents frequency with a scale of
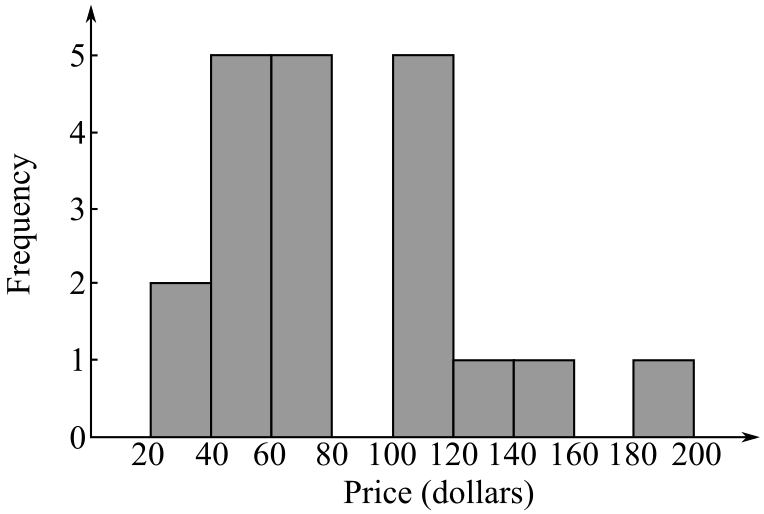
Hence, the histogram corresponding to the corresponding to the data came from a random sample of 20 companies of NASDAQ 100 is drawn.
Want to see more full solutions like this?
Chapter 10 Solutions
MATH W/APPLICAT.W/NOTES GDE +ACCESS CODE


- 8.12 The reading on a voltage meter connected to a test circuit is uniformly distributed over the interval (0, +1), where 0 is the true but unknown voltage of the circuit. Suppose that Y₁, Y2,..., Y, denote a random sample of such readings. a Show that Y is a biased estimator of and compute the bias. b Find a function of Y that is an unbiased estimator of 0. C Find MSE(Y) when Y is used as an estimator of 0.arrow_forwardx 1.1 1.2 1.3 f 3.1 3.9 य find numerical f'(1) by using approximation.arrow_forwardNo chatgpt pls will upvote Already got wrong chatgpt answer Plz no chatgpt downvote.arrow_forward
- Q/Let G be a simple graph-show that if Gis not connected, then it is complement is Connected.arrow_forwardQ/prove that if d (u,v) >2 then there is a vertex z in G st. d (u,v) = d(u, z)+d(z₁v)arrow_forwardT Figure E Statement 33 33° H 40 R 37° 83° S T 55 45 K S 30 U 44 87 H 56 36 ° 54 F 83° 66 P 33 87° ° I 42 200 Rarrow_forward
- Qui find the diameter & radius for a graph PG.arrow_forwardQ7. Prove that " there is no simple graph on four vertices, three of which have degree 3 and the remaining vertex has degree 1". (10M)arrow_forwardStella's friends got her a skydiving lesson for her birthday. Her helicopter took off from the skydiving center, ascending in an angle of 37°, and traveled a distance of 2.1 kilometers before she fell in a straight line perpendicular to the ground. How far from the skydiving center did Stella land? Be sure to have all three parts of a CER answer: make a claim, provide evidence, and explain your reasoning for full credit. 2.1 km Landing spot 37% Skydiving centerarrow_forward
- Solve please thanks!arrow_forwardSolve please and thank youarrow_forwardAccording to Newton's law of universal gravitation, the force F between two bodies of constant mass GmM m and M is given by the formula F = , where G is the gravitational constant and d is the d² distance between the bodies. a. Suppose that G, m, and M are constants. Find the rate of change of force F with respect to distance d. F' (d) 2GmM b. Find the rate of change of force F with gravitational constant G = 6.67 × 10-¹¹ Nm²/kg², on two bodies 5 meters apart, each with a mass of 250 kilograms. Answer in scientific notation, rounding to 2 decimal places. -6.67x10 N/m syntax incomplete.arrow_forward
 Holt Mcdougal Larson Pre-algebra: Student Edition...AlgebraISBN:9780547587776Author:HOLT MCDOUGALPublisher:HOLT MCDOUGAL
 Glencoe Algebra 1, Student Edition, 9780079039897...AlgebraISBN:9780079039897Author:CarterPublisher:McGraw Hill
 Big Ideas Math A Bridge To Success Algebra 1: Stu...AlgebraISBN:9781680331141Author:HOUGHTON MIFFLIN HARCOURTPublisher:Houghton Mifflin Harcourt