
Videos
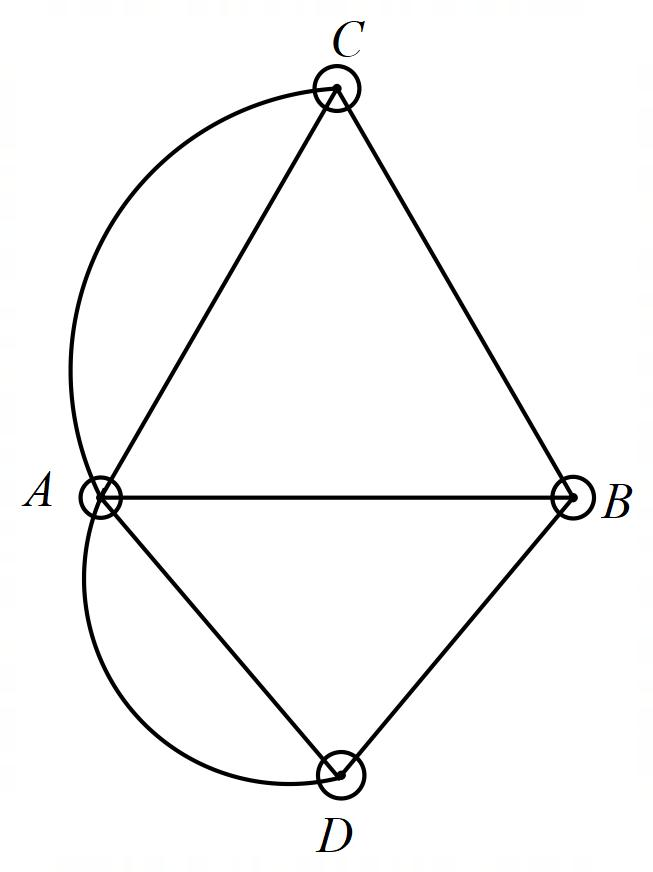
In the Konigsberg Bringe Problem (see fig. 9.1), two new bridges are constructed, one joining A to C and the other B to D. Use Theorem 10.1.4to show that the answer to the question is now yes.
To Prove: The answer to the question is now yes. If in the KonigsbergBringe Problem (see fig. 9.1), two new bridges are constructed, one joining A to C and the other B to D. Use Theorem 10.1.4.
Explanation of Solution
Proof:
The graph of the Konigsberg Bridge Problem is shown as follows:
Now, if we add one path between A and C and another between B and D, the graphical representation of the new problem is as follows.
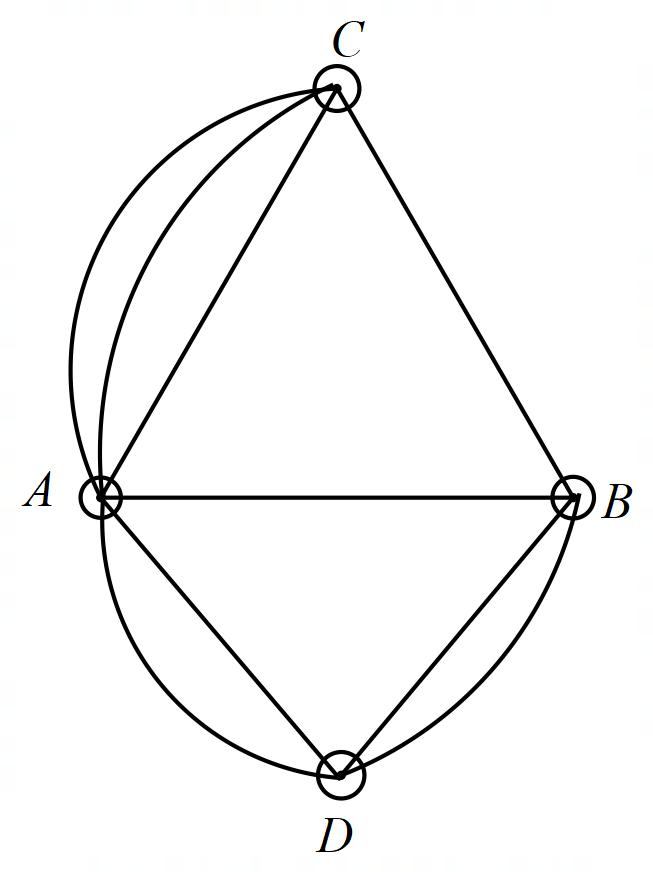
Now theorem states a pseudo- graph (with at least two vertices) is Eulerian if and only if is connected and every vertex is even.
Since the degree of each vertex is also in the new graph, we can say that the connected pseudo graph is Eulerian.
So, the answer is yes.
Want to see more full solutions like this?
Chapter 10 Solutions
Discrete Mathematics with Graph Theory


- Q4*) (make sure you first understand question P5) Discuss the extremisation of the integral I = = √(2(y + 2) ³y' + (x − 7)) c You may find point (iv) in § 3.5 relevant. dx.arrow_forwardQ6*) Describe the plane paths of light in the two-dimensional media in which the light velocities are given respectively by (a) c = a/y, (b) c = a/√y, where a > 0, y > 0.arrow_forwardData Analysis DeltaMath Student Applical X Home $i$ Grades and Attendance x ent/3903821/26770486/bae6d3c1493d9868572f4878b5c163b6 y School St... Quizez And Tests Cancer reserch College Reserch Highschool Reserch Writing SCP Step Reason Statement ADBC 1 Given AD || BC 2 ACCA Reflexive Property try Type of Statement C B +> D A Feb 14arrow_forward
- lim 1 x→0x3 3 So²² 6 tln(1+t) t4 +4 .dt 2arrow_forward2. Suppose the population of Wakanda t years after 2000 is given by the equation f(t) = 45000(1.006). If this trend continues, in what year will the population reach 50,000 people? Show all your work, round your answer to two decimal places, and include units. (4 points)arrow_forward3. Solve the equation, give the answer exactly (no calculator approximations), and show all your work. (4 points) log5 2x = 3arrow_forward
- Examine the Variables: Carefully review and note the names of all variables in the dataset. Examples of these variables include: Mileage (mpg) Number of Cylinders (cyl) Displacement (disp) Horsepower (hp) Research: Google to understand these variables. Statistical Analysis: Select mpg variable, and perform the following statistical tests. Once you are done with these tests using mpg variable, repeat the same with hp Mean Median First Quartile (Q1) Second Quartile (Q2) Third Quartile (Q3) Fourth Quartile (Q4) 10th Percentile 70th Percentile Skewness Kurtosis Document Your Results: In RStudio: Before running each statistical test, provide a heading in the format shown at the bottom. “# Mean of mileage – Your name’s command” In Microsoft Word: Once you've completed all tests, take a screenshot of your results in RStudio and paste it into a Microsoft Word document. Make sure that snapshots are very clear. You will need multiple snapshots. Also transfer these results to the…arrow_forwardIf given is the graph of f(x), then how does the graph of modulus of f(x) will look like(roughly)?arrow_forwardpls helparrow_forward
- Let I = f(x) dx, where f is the function whose graph is shown. 4 2 y f X 1 2 3 4 (a) Use the graph to find L2, R2 and M2. R₂ M2 = = = (b) Are these underestimates or overestimates of I? O 42 is an underestimate. O 42 is an overestimate. ◇ R2 is an underestimate. OR2 is an overestimate. OM2 is an underestimate. ○ M2 is an overestimate. (c) Use the graph to find T2. T₂ =arrow_forwardExamine the Variables: Carefully review and note the names of all variables in the dataset. Examples of these variables include: Mileage (mpg) Number of Cylinders (cyl) Displacement (disp) Horsepower (hp) Research: Google to understand these variables. Statistical Analysis: Select mpg variable, and perform the following statistical tests. Once you are done with these tests using mpg variable, repeat the same with hp Mean Median First Quartile (Q1) Second Quartile (Q2) Third Quartile (Q3) Fourth Quartile (Q4) 10th Percentile 70th Percentile Skewness Kurtosis Document Your Results: In RStudio: Before running each statistical test, provide a heading in the format shown at the bottom. “# Mean of mileage – Your name’s command” In Microsoft Word: Once you've completed all tests, take a screenshot of your results in RStudio and paste it into a Microsoft Word document. Make sure that snapshots are very clear. You will need multiple snapshots. Also transfer these results to the…arrow_forwardVector u has a magnitude of 23 and vector v has a magnitude of 83. The angle between the two vectors is 126 degrees.a) Draw a fully-labelled vector diagram showing the two vectors and the resultant vector when they are added together.b) Find the magnitude of the resultant vector.c) Find the direction of the resultant vector relative to vector u. Solding by finding the x and y of the vectors and addingarrow_forward
 Trigonometry (MindTap Course List)TrigonometryISBN:9781305652224Author:Charles P. McKeague, Mark D. TurnerPublisher:Cengage Learning
 Elementary Geometry For College Students, 7eGeometryISBN:9781337614085Author:Alexander, Daniel C.; Koeberlein, Geralyn M.Publisher:Cengage,
 Elementary Geometry for College StudentsGeometryISBN:9781285195698Author:Daniel C. Alexander, Geralyn M. KoeberleinPublisher:Cengage Learning
 Linear Algebra: A Modern IntroductionAlgebraISBN:9781285463247Author:David PoolePublisher:Cengage Learning
 Holt Mcdougal Larson Pre-algebra: Student Edition...AlgebraISBN:9780547587776Author:HOLT MCDOUGALPublisher:HOLT MCDOUGAL
 Trigonometry (MindTap Course List)TrigonometryISBN:9781337278461Author:Ron LarsonPublisher:Cengage Learning