
Concept explainers
Videos
To plot:
The position of a moving particle as a
and
Answer to Problem 1P
Solution:
The program is stated as follows.
Explanation of Solution
The given equation is,
The
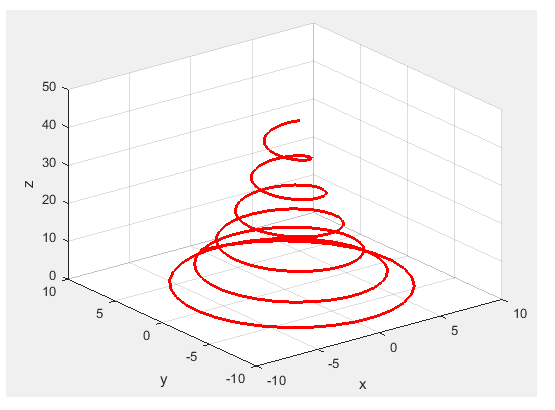
Write the MATLAB code to plot the position of a moving particle as a function of time from the equation,
and
MATLAB Code:
t = 0:0.1:20;
r = 0.01.*(30-t).^2;
x = r.*sin(2.*t);
y = r.*cos(2.*t);
z = 0.5.*t.^(1.5);
plot3(x,y,z,'r','linewidth',2)
grid on
xlabel('x'); ylabel('y'); zlabel('z')
Save the MATLAB script with name, Chapter10_56830_10_1P.m in the current folder. Execute the script by typing the script name at the command window to get the code to plot the position of a moving particle as a function of time from the equation,
and
Result:
Conclusion:
Therefore, the required program is executed above.
Want to see more full solutions like this?
Chapter 10 Solutions
MATLAB: An Introduction with Applications


- Can you rewrite the solution because it is unclear? AM (+) = 8(1+0.5 cos 1000kt +0.5 ros 2000 thts) = cos 10000 πt. 8 cos wat + 4 cos wit + 4 cos Wat coswet. J4000 t j11000rt $14+) = 45 jqooort +4e + e + e j 12000rt. 12000 kt + e +e +e Le jsoort -; goon t te +e Dcw> = 885(W- 100007) + 8 IS (W-10000) - USBarrow_forwardCan you rewrite the solution because it is unclear? Q2 AM ①(+) = 8 (1+0.5 cos 1000πt +0.5 ros 2000kt) $4+) = 45 = *cos 10000 πt. 8 cos wat + 4 cosat + 4 cos Wat coswet. j1000016 +4e -j10000πt j11000Rt j gooort -j 9000 πt + e +e j sooort te +e J11000 t + e te j 12000rt. -J12000 kt + с = 8th S(W- 100007) + 8 IS (W-10000) <&(w) = USB -5-5 -4-5-4 b) Pc 2² = 64 PSB = 42 + 4 2 Pt Pc+ PSB = y = Pe c) Puss = PLSB = = 32 4² = 8 w 32+ 8 = × 100% = 140 (1)³×2×2 31 = 20% x 2 = 3w 302 USB 4.5 5 5.6 6 ms Ac = 4 mi = 0.5 mz Ac = 4 ५ M2 = =0.5arrow_forwardA. Draw the waveform for the following binary sequence using Bipolar RZ, Bipolar NRZ, and Manchester code. Data sequence= (00110100) B. In a binary PCM system, the output signal-to-quantization ratio is to be hold to a minimum of 50 dB. If the message is a single tone with fm-5 kHz. Determine: 1) The number of required levels, and the corresponding output signal-to-quantizing noise ratio. 2) Minimum required system bandwidth.arrow_forward
- Find Io using Mesh analysisarrow_forwardFM station of 100 MHz carrier frequency modulated by a 20 kHz sinusoid with an amplitude of 10 volt, so that the peak frequency deviation is 25 kHz determine: 1) The BW of the FM signal. 2) The approximated BW if the modulating signal amplitude is increased to 50 volt. 3) The approximated BW if the modulating signal frequency is increased by 70%. 4) The amplitude of the modulating signal if the BW is 65 kHz.arrow_forwardAn FDM is used to multiplex two groups of signals using AM-SSB, the first group contains 25 speech signals, each has maximum frequency of 4 kHz, the second group contains 15 music signals, each has maximum frequency of 10 kHz. A guard bandwidth of 500 Hz is used bety each two signals and before the first one. 1. Find the BWmultiplexing 2. Find the BWtransmission if the multiplexing signal is modulated using AM-DSB-LC.arrow_forward
- An FM signal with 75 kHz deviation, has an input signal-to-noise ratio of 18 dB, with a modulating frequency of 15 kHz. 1) Find SNRO at demodulator o/p. 2) Find SNRO at demodulator o/p if AM is used with m=0.3. 3) Compare the performance in case 1) and 2).. Hint: for single tone AM-DSB-LC, SNR₁ = (2m²) (4)arrow_forwardFind Va and Vb using Nodal analysisarrow_forwardCalculate the nodal voltage in the circuitarrow_forward
- Calculate the mesh currents, find Ia, Ib, Ic. Apply mesh analysisarrow_forwardFind Va and Vb using Nodal analysisarrow_forward4. A battery operated sensor transmits to a receiver that is plugged in to a power outlet. The device is continuously operated. The battery is a 3.6 V coin-cell battery with a 245mAHr capacity. The application requires a bit rate of 36 Mbps and an error rate of less than 10^-3. The channel has a center frequency of 2.4 GHz, a bandwidth of 10 MHz and a noise power spectral density of 10^-14 W/Hz. The maximum distance is 36 meters and the losses in the channel attenuates the signal by 0.25 dB/meter. Your company has two families of chips that you can use. An M-ary ASK and an M-ary QAM chip. The have very different power requirements as shown in the table below. The total current for the system is the current required to achieve the desired Eb/No PLUS the current identified below: Hokies PSK Chip Set Operating Current NOT Including the required Eb/No for the application Hokies QAM Chip Set Operating Current NOT Including the required Eb/No for the application Chip ID M-ary Voltage (volts)…arrow_forward
 Introductory Circuit Analysis (13th Edition)Electrical EngineeringISBN:9780133923605Author:Robert L. BoylestadPublisher:PEARSON
 Delmar's Standard Textbook Of ElectricityElectrical EngineeringISBN:9781337900348Author:Stephen L. HermanPublisher:Cengage Learning
 Programmable Logic ControllersElectrical EngineeringISBN:9780073373843Author:Frank D. PetruzellaPublisher:McGraw-Hill Education
 Fundamentals of Electric CircuitsElectrical EngineeringISBN:9780078028229Author:Charles K Alexander, Matthew SadikuPublisher:McGraw-Hill Education
 Electric Circuits. (11th Edition)Electrical EngineeringISBN:9780134746968Author:James W. Nilsson, Susan RiedelPublisher:PEARSON
 Engineering ElectromagneticsElectrical EngineeringISBN:9780078028151Author:Hayt, William H. (william Hart), Jr, BUCK, John A.Publisher:Mcgraw-hill Education,