
Statistics for Business and Economics (13th Edition)
13th Edition
ISBN: 9780134506593
Author: James T. McClave, P. George Benson, Terry Sincich
Publisher: PEARSON
expand_more
expand_more
format_list_bulleted
Concept explainers
Videos
Textbook Question
Chapter 10, Problem 10.2.1A
In this Activity, you will revisit Activity 3.1, Exit Polls (p. 186). For convenience, the table shown in that activity is repeated here.
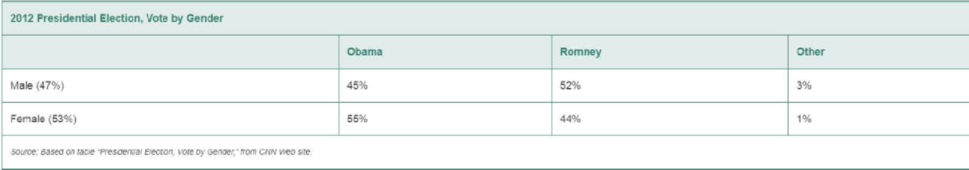
1. Determine whether the table above and the similar tables that you found for Activity 3.1 are contingency tables. If not, do you have enough information to create a
Expert Solution & Answer
Want to see the full answer?
Check out a sample textbook solution
Students have asked these similar questions
What were the average sales for the four weeks prior to the experiment?
What were the sales during the four weeks when the stores used the digital display?
What is the mean difference in sales between the experimental and regular POP time periods?
State the null hypothesis being tested by the paired sample t-test.
Do you reject or retain the null hypothesis?
At a 95% significance level, was the difference significant? Explain why or why not using the results from the paired sample t-test.
Should the manager of the retail chain install new digital displays in each store? Justify your answer.
A retail chain is interested in determining whether a digital video point-of-purchase (POP) display would stimulate higher sales for a brand advertised compared to the standard cardboard point-of-purchase display. To test this, a one-shot static group design experiment was conducted over a four-week period in 100 different stores. Fifty stores were randomly assigned to the control treatment (standard display) and the other 50 stores were randomly assigned to the experimental treatment (digital display). Compare the sales of the control group (standard POP) to the experimental group (digital POP).
What were the average sales for the standard POP display (control group)?
What were the sales for the digital display (experimental group)?
What is the (mean) difference in sales between the experimental group and control group?
List the null hypothesis being tested.
Do you reject or retain the null hypothesis based on the results of the independent t-test?
Was the difference between the…
Question 4
An article in Quality Progress (May 2011, pp. 42-48) describes the use of factorial experiments to improve a
silver powder production process. This product is used in conductive pastes to manufacture a wide variety of
products ranging from silicon wafers to elastic membrane switches. Powder density (g/cm²) and surface area
(cm/g) are the two critical characteristics of this product. The experiments involved three factors: reaction
temperature, ammonium percentage, stirring rate. Each of these factors had two levels, and the design was
replicated twice. The design is shown in Table 3.
A222222222222233
Stir Rate
(RPM)
Ammonium
(%)
Table 3: Silver Powder Experiment from Exercise 13.23
Temperature
(°C)
Density
Surface Area
100
8
14.68
0.40
100
8
15.18
0.43
30
100
8
15.12
0.42
30
100
17.48
0.41
150
7.54
0.69
150
8
6.66
0.67
30
150
8
12.46
0.52
30
150
8
12.62
0.36
100
40
10.95
0.58
100
40
17.68
0.43
30
100
40
12.65
0.57
30
100
40
15.96
0.54
150
40
8.03
0.68
150
40
8.84
0.75
30
150…
Chapter 10 Solutions
Statistics for Business and Economics (13th Edition)
Ch. 10.2 - Find the rejection region for a one-dimensional 2...Ch. 10.2 - What are the characteristics of a multinomial...Ch. 10.2 - What conditions must n satisfy to make the 2 test...Ch. 10.2 - A multinomial experiment with k = 3 cells and n =...Ch. 10.2 - Prob. 10.5LMCh. 10.2 - Cable TV subscriptions and cord cutters. Refer to...Ch. 10.2 - Do social robots walk or roll? Refer to the...Ch. 10.2 - Rankings of MBA programs. Business Ethics (Fall...Ch. 10.2 - Museum management. Refer to the Museum Management...Ch. 10.2 - Offshoring companies. Offshoring is a term that...
Ch. 10.2 - Prob. 10.11ACICh. 10.2 - Prob. 10.12ACICh. 10.2 - Mobile device typing strategies. Text messaging on...Ch. 10.2 - Prob. 10.14ACICh. 10.2 - Coupon user study. A hot topic in marketing...Ch. 10.2 - Cell phone user survey. If you subscribe to a cell...Ch. 10.2 - Overloading in the trucking industry. Although...Ch. 10.2 - Political representation of religious groups. Do...Ch. 10.3 - Find the rejection region for a test of...Ch. 10.3 - Consider the 2 3 (i e., r = 2 and = 3)...Ch. 10.3 - Refer to Exercise 10.20. a. Convert the frequency...Ch. 10.3 - Test the null hypothesis of independence of the...Ch. 10.3 - Refer to Exercise 10.22. a. Convert the responses...Ch. 10.3 - Safety of hybrid cars. According to the Highway...Ch. 10.3 - Purchasing souvenirs. A major tourist activity is...Ch. 10.3 - Prob. 10.26ACBCh. 10.3 - Are travel professionals equitably paid? Business...Ch. 10.3 - Eyewitnesses and mugshots. Refer to the Applied...Ch. 10.3 - Package design influences taste. Can the package...Ch. 10.3 - Job satisfaction of women in construction. The...Ch. 10.3 - Offshoring companies. Refer to The Journal of...Ch. 10.3 - Prob. 10.32ACICh. 10.3 - Prob. 10.33ACICh. 10.3 - Prob. 10.34ACICh. 10.3 - Prob. 10.35ACICh. 10.3 - Prob. 10.36ACICh. 10.3 - Prob. 10.37ACICh. 10.3 - Coupon user study. Refer to the study of a...Ch. 10.3 - Examining the Monty Hall Dilemma. In Exercise...Ch. 10 - A random sample of 250 observations was classified...Ch. 10 - Prob. 10.41LMCh. 10 - Made in the USA survey. Refer to the Journal of...Ch. 10 - Prob. 10.43ACBCh. 10 - Survey on giving and volunteering (continued)....Ch. 10 - Stereotyping in deceptive and authentic news...Ch. 10 - Prob. 10.46ACBCh. 10 - Prob. 10.47ACICh. 10 - Pig farm study. An article in Sociological Methods...Ch. 10 - Management system failures. Refer to the Process...Ch. 10 - History of corporate acquisitions. Refer to the...Ch. 10 - Creating menus to influence others. Refer to the...Ch. 10 - Prob. 10.52ACICh. 10 - Prob. 10.53ACICh. 10 - Prob. 10.54ACICh. 10 - Flight lesponse of geese to helicopter traffic....Ch. 10 - Prob. 10.56ACACh. 10 - Goodness-of-fit test. A statistics analysis is to...Ch. 10 - Prob. 10.58CTCCh. 10 - A television station has hired an independent...Ch. 10 - Suppose the television station believes that a...Ch. 10 - Generalize the situations in Exercises 1 and 2 to...Ch. 10 - In this Activity, you will revisit Activity 3.1,...Ch. 10 - Prob. 10.2.2ACh. 10 - Perform a x2 test for independence for the example...
Knowledge Booster


Learn more about
Need a deep-dive on the concept behind this application? Look no further. Learn more about this topic, statistics and related others by exploring similar questions and additional content below.Similar questions
- - + ++ Table 2: Crack Experiment for Exercise 2 A B C D Treatment Combination (1) Replicate I II 7.037 6.376 14.707 15.219 |++++ 1 བྱ॰༤༠སྦྱོ སྦྱོཋཏྟཱུ a b ab 11.635 12.089 17.273 17.815 с ас 10.403 10.151 4.368 4.098 bc abc 9.360 9.253 13.440 12.923 d 8.561 8.951 ad 16.867 17.052 bd 13.876 13.658 abd 19.824 19.639 cd 11.846 12.337 acd 6.125 5.904 bcd 11.190 10.935 abcd 15.653 15.053 Question 3 Continuation of Exercise 2. One of the variables in the experiment described in Exercise 2, heat treatment method (C), is a categorical variable. Assume that the remaining factors are continuous. (a) Write two regression models for predicting crack length, one for each level of the heat treatment method variable. What differences, if any, do you notice in these two equations? (b) Generate appropriate response surface contour plots for the two regression models in part (a). (c) What set of conditions would you recommend for the factors A, B, and D if you use heat treatment method C = +? (d) Repeat…arrow_forwardQuestion 2 A nickel-titanium alloy is used to make components for jet turbine aircraft engines. Cracking is a potentially serious problem in the final part because it can lead to nonrecoverable failure. A test is run at the parts producer to determine the effect of four factors on cracks. The four factors are: pouring temperature (A), titanium content (B), heat treatment method (C), amount of grain refiner used (D). Two replicates of a 24 design are run, and the length of crack (in mm x10-2) induced in a sample coupon subjected to a standard test is measured. The data are shown in Table 2. 1 (a) Estimate the factor effects. Which factor effects appear to be large? (b) Conduct an analysis of variance. Do any of the factors affect cracking? Use a = 0.05. (c) Write down a regression model that can be used to predict crack length as a function of the significant main effects and interactions you have identified in part (b). (d) Analyze the residuals from this experiment. (e) Is there an…arrow_forwardA 24-1 design has been used to investigate the effect of four factors on the resistivity of a silicon wafer. The data from this experiment are shown in Table 4. Table 4: Resistivity Experiment for Exercise 5 Run A B с D Resistivity 1 23 2 3 4 5 6 7 8 9 10 11 12 I+I+I+I+Oooo 0 0 ||++TI++o000 33.2 4.6 31.2 9.6 40.6 162.4 39.4 158.6 63.4 62.6 58.7 0 0 60.9 3 (a) Estimate the factor effects. Plot the effect estimates on a normal probability scale. (b) Identify a tentative model for this process. Fit the model and test for curvature. (c) Plot the residuals from the model in part (b) versus the predicted resistivity. Is there any indication on this plot of model inadequacy? (d) Construct a normal probability plot of the residuals. Is there any reason to doubt the validity of the normality assumption?arrow_forward
- Stem1: 1,4 Stem 2: 2,4,8 Stem3: 2,4 Stem4: 0,1,6,8 Stem5: 0,1,2,3,9 Stem 6: 2,2 What’s the Min,Q1, Med,Q3,Max?arrow_forwardAre the t-statistics here greater than 1.96? What do you conclude? colgPA= 1.39+0.412 hsGPA (.33) (0.094) Find the P valuearrow_forwardA poll before the elections showed that in a given sample 79% of people vote for candidate C. How many people should be interviewed so that the pollsters can be 99% sure that from 75% to 83% of the population will vote for candidate C? Round your answer to the whole number.arrow_forward
- Suppose a random sample of 459 married couples found that 307 had two or more personality preferences in common. In another random sample of 471 married couples, it was found that only 31 had no preferences in common. Let p1 be the population proportion of all married couples who have two or more personality preferences in common. Let p2 be the population proportion of all married couples who have no personality preferences in common. Find a95% confidence interval for . Round your answer to three decimal places.arrow_forwardA history teacher interviewed a random sample of 80 students about their preferences in learning activities outside of school and whether they are considering watching a historical movie at the cinema. 69 answered that they would like to go to the cinema. Let p represent the proportion of students who want to watch a historical movie. Determine the maximal margin of error. Use α = 0.05. Round your answer to three decimal places. arrow_forwardA random sample of medical files is used to estimate the proportion p of all people who have blood type B. If you have no preliminary estimate for p, how many medical files should you include in a random sample in order to be 99% sure that the point estimate will be within a distance of 0.07 from p? Round your answer to the next higher whole number.arrow_forward
- A clinical study is designed to assess the average length of hospital stay of patients who underwent surgery. A preliminary study of a random sample of 70 surgery patients’ records showed that the standard deviation of the lengths of stay of all surgery patients is 7.5 days. How large should a sample to estimate the desired mean to within 1 day at 95% confidence? Round your answer to the whole number.arrow_forwardA clinical study is designed to assess the average length of hospital stay of patients who underwent surgery. A preliminary study of a random sample of 70 surgery patients’ records showed that the standard deviation of the lengths of stay of all surgery patients is 7.5 days. How large should a sample to estimate the desired mean to within 1 day at 95% confidence? Round your answer to the whole number.arrow_forwardIn the experiment a sample of subjects is drawn of people who have an elbow surgery. Each of the people included in the sample was interviewed about their health status and measurements were taken before and after surgery. Are the measurements before and after the operation independent or dependent samples?arrow_forward
arrow_back_ios
SEE MORE QUESTIONS
arrow_forward_ios
Recommended textbooks for you
 Mathematics For Machine TechnologyAdvanced MathISBN:9781337798310Author:Peterson, John.Publisher:Cengage Learning,
 Holt Mcdougal Larson Pre-algebra: Student Edition...AlgebraISBN:9780547587776Author:HOLT MCDOUGALPublisher:HOLT MCDOUGAL
 Glencoe Algebra 1, Student Edition, 9780079039897...AlgebraISBN:9780079039897Author:CarterPublisher:McGraw Hill
 Functions and Change: A Modeling Approach to Coll...AlgebraISBN:9781337111348Author:Bruce Crauder, Benny Evans, Alan NoellPublisher:Cengage Learning
 Algebra: Structure And Method, Book 1AlgebraISBN:9780395977224Author:Richard G. Brown, Mary P. Dolciani, Robert H. Sorgenfrey, William L. ColePublisher:McDougal Littell
 Big Ideas Math A Bridge To Success Algebra 1: Stu...AlgebraISBN:9781680331141Author:HOUGHTON MIFFLIN HARCOURTPublisher:Houghton Mifflin Harcourt
Mathematics For Machine Technology
Advanced Math
ISBN:9781337798310
Author:Peterson, John.
Publisher:Cengage Learning,
Holt Mcdougal Larson Pre-algebra: Student Edition...
Algebra
ISBN:9780547587776
Author:HOLT MCDOUGAL
Publisher:HOLT MCDOUGAL
Glencoe Algebra 1, Student Edition, 9780079039897...
Algebra
ISBN:9780079039897
Author:Carter
Publisher:McGraw Hill
Functions and Change: A Modeling Approach to Coll...
Algebra
ISBN:9781337111348
Author:Bruce Crauder, Benny Evans, Alan Noell
Publisher:Cengage Learning
Algebra: Structure And Method, Book 1
Algebra
ISBN:9780395977224
Author:Richard G. Brown, Mary P. Dolciani, Robert H. Sorgenfrey, William L. Cole
Publisher:McDougal Littell
Big Ideas Math A Bridge To Success Algebra 1: Stu...
Algebra
ISBN:9781680331141
Author:HOUGHTON MIFFLIN HARCOURT
Publisher:Houghton Mifflin Harcourt
Statistics 4.1 Point Estimators; Author: Dr. Jack L. Jackson II;https://www.youtube.com/watch?v=2MrI0J8XCEE;License: Standard YouTube License, CC-BY
Statistics 101: Point Estimators; Author: Brandon Foltz;https://www.youtube.com/watch?v=4v41z3HwLaM;License: Standard YouTube License, CC-BY
Central limit theorem; Author: 365 Data Science;https://www.youtube.com/watch?v=b5xQmk9veZ4;License: Standard YouTube License, CC-BY
Point Estimate Definition & Example; Author: Prof. Essa;https://www.youtube.com/watch?v=OTVwtvQmSn0;License: Standard Youtube License
Point Estimation; Author: Vamsidhar Ambatipudi;https://www.youtube.com/watch?v=flqhlM2bZWc;License: Standard Youtube License