
(a)
Interpretation:
The least square analysis needs to be performed to determine the intercept, slopeand regression statistics, including the standard deviation about regression.
Concept introduction:
The least square analysis is defined as the method in which the final answer for the set of data points is calculated by the minimizing the summation of residue of set of data point from the given curve.
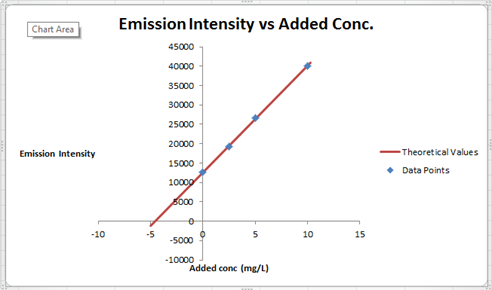
The equation for straight line is represented as follows:
Answer to Problem 10.11QAP
To satisfy the equation
Explanation of Solution
Least Square Analysis

The summary of calculation is as follows.
| Added Au | Emission Intensity (y) | ||
| 0 | 12568 | ||
| 2.5 | 19324 | ||
| 5 | 26622 | ||
| 10 | 40021 | ||
| m | c | 2752.72 | 12590.6 |
| sm | sb | 30.7796445 | 176.3126 |
| r2 | sy | 0.99975001 | 227.6185 |
Here, the sigma values focus on the errors present in the parameter.
So far, we have filled
Now, we must determine the concentration of gold and its uncertainty. The concentration of gold is x. intercept of the graph, because that is the point at which the gold is absence so the difference between that and the zero added point must be the gold concentration in sample.
Now, x is a function of c and m. Thus, the uncertainty in them will be propagated to x as well. We have the following since m and c are independent.
x = x(m,c)
By propagation of uncertainty,
This is, however, the standard error. Assuming the distribution of value to be normal about the value of x, this value would give an interval of 63.5% probability. However, if we want a 95% probability interval, we will have to multiply the error in x by 1.96.
(b)
Interpretation:
The concentration of gold in the sample solution in mg/L needs to be determined using the calculated values.
Concept introduction:
The least square analysis is defined as the method in which the final answer for the set of data points is calculated by the minimizing the summation of residue of set of data point from the given curve.
The equation for straight line is represented as follows:
Answer to Problem 10.11QAP
Concentration of gold in sample =
Explanation of Solution
Least Square Analysis
The summary of calculation is as follows.
| Added Au | Emission Intensity (y) | ||
| 0 | 12568 | ||
| 2.5 | 19324 | ||
| 5 | 26622 | ||
| 10 | 40021 | ||
| m | c | 2752.72 | 12590.6 |
| sm | sb | 30.7796445 | 176.3126 |
| r2 | sy | 0.99975001 | 227.6185 |
Here, the sigma values focus on the errors present in the parameter.
So far, we have filled
Now, we must determine the concentration of gold and its uncertainty. The concentration of gold is x. intercept of the graph, because that is the point at which the gold is absence so the difference between that and the zero added point must be the gold concentration in sample.
Now, x is a function of c and m. Thus, the uncertainty in them will be propagated to x as well. We have the following since m and c are independent.
x = x(m,c)
By propagation of uncertainty,
This is however, the standard error. Assuming the distribution of value to be normal about the value of x, this value would give an interval of 63.5% probability. However, if we want a 95% probability interval, we will have to multiply the error in x by 1.96.
Concentration of gold in sample =
(c)
Interpretation:
The concentration of gold in the sample is 8.51 mg/L needs to be determined and the hypothesis that the results equals the 95% confidence level needs to be tested.
Concept introduction:
The least square analysis is defined as the method in which the final answer for the set of data points is calculated by the minimizing the summation of residue of set of data point from the given curve.
The equation for straight line is represented as follows:
Answer to Problem 10.11QAP
Considering a confidence interval of 95% we have concentration of
Explanation of Solution
Least Square Analysis

The summary of calculation is as follows.
| Added Au | Emission Intensity (y) | ||
| 0 | 12568 | ||
| 2.5 | 19324 | ||
| 5 | 26622 | ||
| 10 | 40021 | ||
| m | c | 2752.72 | 12590.6 |
| sm | sb | 30.7796445 | 176.3126 |
| r2 | sy | 0.99975001 | 227.6185 |
Here, the sigma values focus on the errors present in the parameter.
So far, we have filled
Now, we must determine the concentration of gold and its uncertainty. The concentration of gold is x. intercept of the graph, because that is the point at which the gold is absence so the difference between that and the zero added point must be the gold concentration in sample.
Now, x is a function of c and m. Thus, the uncertainty in them will be propagated to x as well. We have the following since m and c are independent.
x = x(m,c)
By propagation of uncertainty,
This is however, the standard error. Assuming the distribution of value to be normal about the value of x, this value would give an interval of 63.5% probability. However, if we want a 95% probability interval, we will have to multiply the error in x by 1.96.
Considering a confidence interval of 95% we have concentration of
Want to see more full solutions like this?
Chapter 10 Solutions
Principles of Instrumental Analysis

- What is the missing reactant R in this organic reaction? ་ ་ ་ ་ ་ ་ ་ ་ ་ ་ +R H3O+ • Draw the structure of R in the drawing area below. N • Be sure to use wedge and dash bonds if it's necessary to draw one particular enantiomer. Click and drag to start drawing a structure.arrow_forwardWrite the systematic name of each organic molecule: H structure H OH OH H OH name ☐ OHarrow_forwardDetermine whether each of the following molecules is a hemiacetal, acetal, or neither and select the appropriate box in the table. CH3O OH OH OH hemiacetal acetal neither hemiacetal acetal neither Xarrow_forward
- What is the missing reactant R in this organic reaction? N N དལ་ད་་ + R • Draw the structure of R in the drawing area below. • Be sure to use wedge and dash bonds if it's necessary to draw one particular enantiomer. Click and drag to start drawing a structure. ㄖˋarrow_forwardDraw the condensed structure of 4-hydroxy-3-methylbutanal. Click anywhere to draw the first atom of your structure.arrow_forwardUsing the bond energy values, calculate the energy that must be supplied or is released upon the polymerization of 755 monomers. If energy must be supplied, provide a positive number; if energy is released, provide a negative number. Hint: Avogadro’s number is 6.02 × 1023.arrow_forward
- -AG|F=2E|V 3. Before proceeding with this problem you may want to glance at p. 466 of your textbook where various oxo-phosphorus derivatives and their oxidation states are summarized. Shown below are Latimer diagrams for phosphorus at pH values at 0 and 14: Acidic solution -0.93 +0.38 -0.51 -0.06 H3PO4 →H4P206 H3PO3 H3PO2 → P→ PH3 -0.28 -0.50 → -0.50 Basic solution 3-1.12 -1.57 -2.05 -0.89 PO HPO →→H2PO2 P PH3 -1.73 a) Under acidic conditions, H3PO4 can be reduced into H3PO3 directly (-0.28V), or via the formation and reduction of H4P2O6 (-0.93/+0.38V). Calculate the values of AG's for both processes; comment. (3 points) 0.5 PH, 0.0 -0.5- 2 3 9 3 -1.5 -2.0 Pa H,PO H,PO H,PO -3 -1 0 2 4 Oxidation state, N 2 b) Frost diagram for phosphorus under acidic conditions is shown. Identify possible disproportionation and comproportionation processes; write out chemical equations describing them. (2 points) c) Elemental phosphorus tends to disproportionate under basic conditions. Use data in…arrow_forwardThese two reactions appear to start with the same starting materials but result in different products. How do the chemicals know which product to form? Are both products formed, or is there some information missing that will direct them a particular way?arrow_forwardWhat would be the best choices for the missing reagents 1 and 3 in this synthesis? 1. PPh3 3 1 2 2. n-BuLi • Draw the missing reagents in the drawing area below. You can draw them in any arrangement you like. • Do not draw the missing reagent 2. If you draw 1 correctly, we'll know what it is. • Note: if one of your reagents needs to contain a halogen, use bromine. Explanation Check Click and drag to start drawing a structure. 2025 McGraw Hill LLC. All Rights Reserved. Terms of Use | Priva ×arrow_forward
- Predict the products of this organic reaction: Explanation Check IN NaBH3CN H+ ? Click and drag to start drawing a structure. D 5 C +arrow_forwardPredict the products of this organic reaction: H3O+ + ? • Draw all the reasonable products in the drawing area below. If there are no products, because no reaction will occur, check the box under the drawing area. • Include both major and minor products, if some of the products will be more common than others. • Be sure to use wedge and dash bonds if you need to distinguish between enantiomers. No reaction. Click and drag to start drawing a structure. dmarrow_forwardIarrow_forward
 Chemistry: Principles and PracticeChemistryISBN:9780534420123Author:Daniel L. Reger, Scott R. Goode, David W. Ball, Edward MercerPublisher:Cengage Learning
 Chemistry & Chemical ReactivityChemistryISBN:9781337399074Author:John C. Kotz, Paul M. Treichel, John Townsend, David TreichelPublisher:Cengage Learning
 Chemistry & Chemical ReactivityChemistryISBN:9781133949640Author:John C. Kotz, Paul M. Treichel, John Townsend, David TreichelPublisher:Cengage Learning