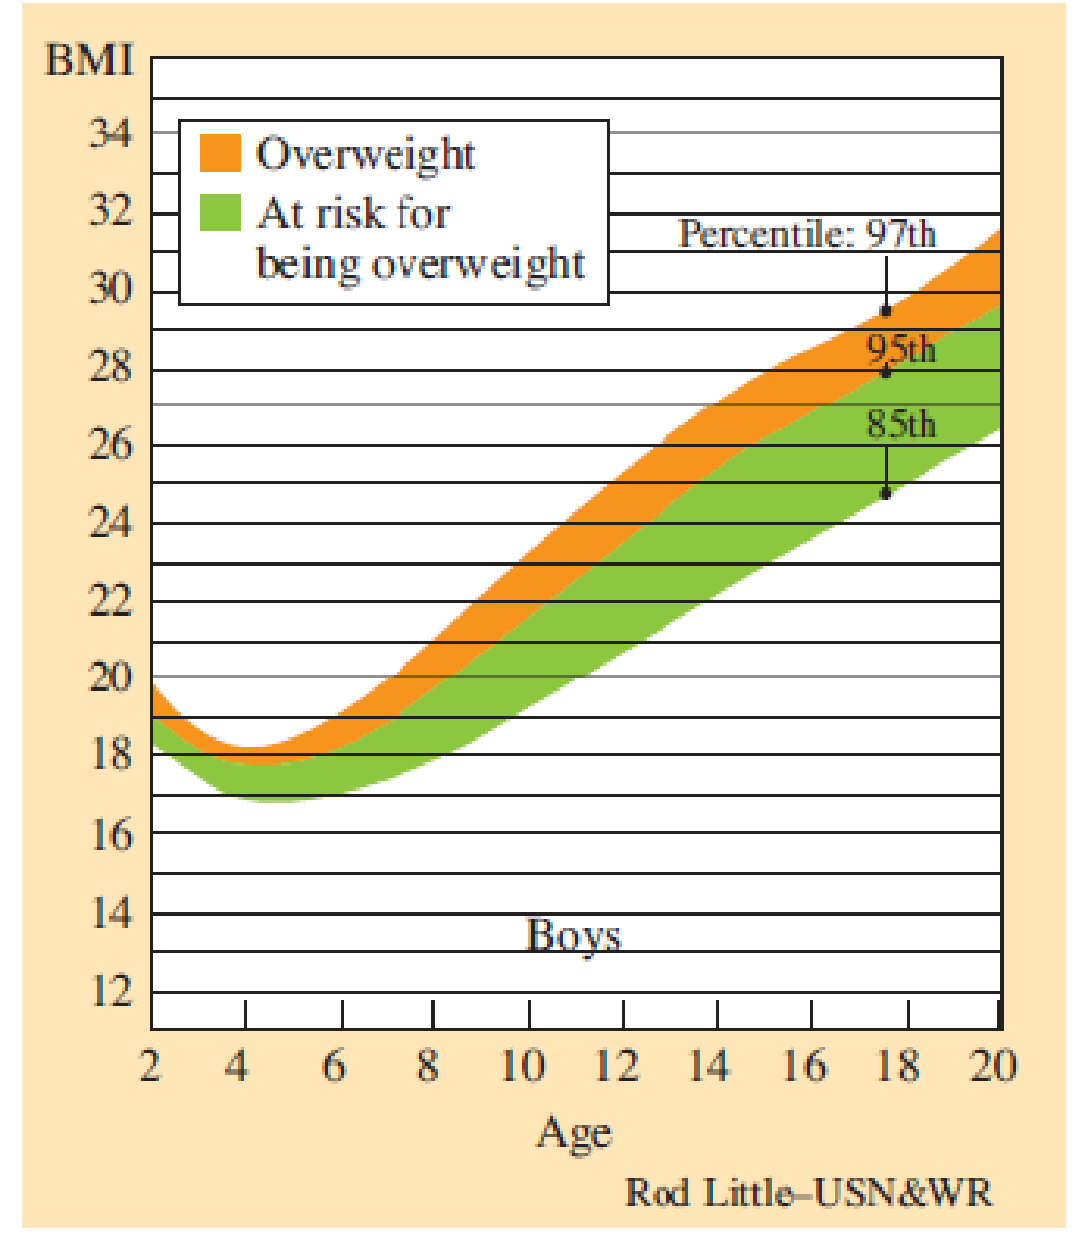
Body Mass Index The federal government gives a procedure to determine if a child is overweight. To make this decision, first determine the child’s body mass index (BMI). Then compare the BMI with one of the two charts, one for boys and one for girls, provided by the government. Below, we give the chart for boys up to age 20. To determine a child’s BMI:
- A. Divide the child’s weight (in pounds) by the child’s height (in inches).
- B. Divide the results from part 1 by the child’s height again.
- C. Multiply the result from part 2 by 703.
Richard is a 14-year-old boy who weighs 130 lb and is 63 in. tall.
- a. Determine his BMI.
- b. Does he appear to be at risk for being overweight, or is he overweight? Explain.

Want to see the full answer?
Check out a sample textbook solution
Chapter 1 Solutions
Books a la carte edition for A Survey of Mathematics with Applications (10th Edition)
Additional Math Textbook Solutions
Pathways To Math Literacy (looseleaf)
Precalculus: Mathematics for Calculus (Standalone Book)
Elementary Statistics ( 3rd International Edition ) Isbn:9781260092561
APPLIED STAT.IN BUS.+ECONOMICS
Elementary Statistics: A Step By Step Approach
Elementary Statistics: Picturing the World (7th Edition)
- 3. Let sin (22) + cos (T2) f(z) = z(22 + 1)(z+1) Compute f(z)dz over each of the contours/closed curves C1, C2, C3 and C4 shown below. L 10 -C x Don't use any Al tool show ur answer pe n and paper then takearrow_forwardwhat is the slope of the linear equation-5x+2y-10=0arrow_forward1. Evaluate (2,5) (3x+y)dx+(2y-x)dy (0,1) (i) along the straight lines from (0, 1) to (2, 1) and then from (2, 1) to (2,5), and (ii) along the parabola y = x² + 1. Don't use any Al tool show ur answer in pe n and paper then takearrow_forward
- Don't use any Al tool show ur answer in pe n and paper then take 20. Solve the given system of differential equations: x' = x+y, x(0) = 0 y' = 2x, y(0) = 1arrow_forward4. Verify the Cauchy-Goursat theorem for the function f(z) =225z around the closed curve C defined by a half circle || = 1 from the point (1,0) to (-1, 0) in the counterclockwise direction and then the straight line from (-1,0) to (1,0). Don't use any Al tool show ur answer in pe n and paper then takearrow_forward2. Evaluate the following integral using cauchy integral theorem: ||=3 sin (22)+cos (22) (2-1)(2-2) -dz Don't use any Al tool show ur answer in pe n and paper then takearrow_forward
- 18. Solve the given differential equation: y' + y = f(t), y(0) = 5, where f(t) = 0arrow_forward16. Solve the given differential equation: y" + 4y Given, = sin (t)u(t2), y(0) = 1, y'(0) = 0 1 = (x² + 1)(x²+4) 1/3 -1/3 + x²+1 x²+4 Don't use any Al tool show ur answer in pe n and paper then takearrow_forwardHow to solve and explain (7x^2 -10x +11)-(9x^2 -4x + 6)arrow_forwardarrow_back_iosSEE MORE QUESTIONSarrow_forward_ios
 Glencoe Algebra 1, Student Edition, 9780079039897...AlgebraISBN:9780079039897Author:CarterPublisher:McGraw Hill
 Holt Mcdougal Larson Pre-algebra: Student Edition...AlgebraISBN:9780547587776Author:HOLT MCDOUGALPublisher:HOLT MCDOUGAL
 Big Ideas Math A Bridge To Success Algebra 1: Stu...AlgebraISBN:9781680331141Author:HOUGHTON MIFFLIN HARCOURTPublisher:Houghton Mifflin Harcourt
 Algebra: Structure And Method, Book 1AlgebraISBN:9780395977224Author:Richard G. Brown, Mary P. Dolciani, Robert H. Sorgenfrey, William L. ColePublisher:McDougal Littell


