
Introduction To Probability And Statistics
15th Edition
ISBN: 9781337554428
Author: Mendenhall, William.
Publisher: Cengage Learning,
expand_more
expand_more
format_list_bulleted
Videos
Textbook Question
Chapter 1, Problem 5RWYL
World Lakes A lake is a body of water surrounded by land. Hence, some bodies of water named “seas,” like the Caspian Sea, are actually salt lakes. In the table that follows, the length in miles is listed for the major natural lakes of the world, excluding the Caspian Sea, which has a length of 760 miles.5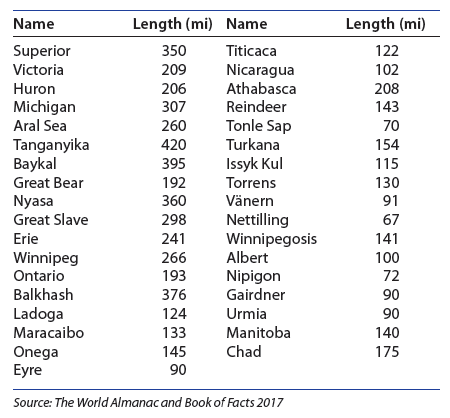
a. Use a stem and leaf plot to describe the lengths of the world’s major lakes.
b. Use a histogram to display these same data. How does this compare to the stem and leaf plot in part a?
c. Are these data symmetric or skewed? If skewed, what is the direction of the skewing?
Expert Solution & Answer
Want to see the full answer?
Check out a sample textbook solution
Students have asked these similar questions
a small pond contains eight catfish and six bluegill. If seven fish are caught at random, what is the probability that exactly five catfish have been caught?
23 The line graph in the following figure shows
Revenue ($ millions)
one company's revenues over time. Explain
why this graph is misleading and what you
can do to fix the problem.
700
60-
50-
40
30
Line Graph of Revenue
20-
101
1950
1970
1975 1980 1985
Year
1990
2000
d of the
20
respectively.
Interpret the shape, center and spread of the
following box plot.
14
13
12
11
10
6
T
89
7
9
5.
治
Chapter 1 Solutions
Introduction To Probability And Statistics
Ch. 1.1 - Experimental UnitsDefine the experimental units...Ch. 1.1 - Experimental UnitsDefine the experimental units...Ch. 1.1 - Experimental UnitsDefine the experimental units...Ch. 1.1 - Experimental UnitsDefine the experimental units...Ch. 1.1 - Experimental UnitsDefine the experimental units...Ch. 1.1 - Qualitative or Quantitative? Are the variables in...Ch. 1.1 - Qualitative or Quantitative? Are the variables in...Ch. 1.1 - Qualitative or Quantitative? Are the variables in...Ch. 1.1 - Qualitative or Quantitative? Are the variables in...Ch. 1.1 - Discrete or Continuous? Are the variables in...
Ch. 1.1 - Discrete or Continuous? Are the variables in...Ch. 1.1 - Discrete or Continuous? Are the variables in...Ch. 1.1 - Discrete or Continuous? Are the variables in...Ch. 1.1 - Discrete or Continuous? Are the variables in...Ch. 1.1 - Discrete or Continuous? Are the variables in...Ch. 1.1 - Discrete or Continuous? Are the variables in...Ch. 1.1 - Discrete or Continuous? Are the variables in...Ch. 1.1 - Discrete or Continuous? Are the variables in...Ch. 1.1 - Populations or Samples? In Exercises 1922,...Ch. 1.1 - Populations or Samples? In Exercises 1922,...Ch. 1.1 - Populations or Samples? In Exercises 1922,...Ch. 1.1 - Populations or Samples? In Exercises 1922,...Ch. 1.1 - Parking on Campus Six vehicles selected from a...Ch. 1.1 - Past U.S. Presidents A data set gives the ages at...Ch. 1.1 - Voter Attitudes You are a candidate for your state...Ch. 1.1 - Cancer Survival Times A researcher wants to...Ch. 1.1 - New Teaching Methods A researcher wants to know...Ch. 1.2 - Pie and Bar Charts The data in Exercises 13...Ch. 1.2 - Pie and Bar Charts The data in Exercises 13...Ch. 1.2 - Pie and Bar Charts The data in Exercises 13...Ch. 1.2 - Groups of People Fifty people are grouped into...Ch. 1.2 - Presidential Popularity After the elections of...Ch. 1.2 - Presidential Popularity After the elections of...Ch. 1.2 - Presidential Popularity After the elections of...Ch. 1.2 - Presidential Popularity After the elections of...Ch. 1.2 - Presidential Popularity After the elections of...Ch. 1.2 - Prob. 10ECh. 1.2 - Prob. 11ECh. 1.2 - Prob. 12ECh. 1.2 - Prob. 13ECh. 1.2 - Prob. 14ECh. 1.2 - Prob. 15ECh. 1.2 - Back to Work How long does it take you to adjust...Ch. 1.2 - Prob. 17ECh. 1.2 - Prob. 18ECh. 1.2 - Prob. 19ECh. 1.2 - Prob. 20ECh. 1.2 - Prob. 21ECh. 1.3 - DotplotsConstruct a dotplot for the data given in...Ch. 1.3 - DotplotsConstruct a dotplot for the data given in...Ch. 1.3 - Stem and Leaf I Construct a stem and leaf plot for...Ch. 1.3 - Stem and Leaf I Construct a stem and leaf plot for...Ch. 1.3 - Stem and Leaf I Construct a stem and leaf plot for...Ch. 1.3 - Stem and Leaf II Use the following set of data...Ch. 1.3 - Stem and Leaf II Use the following set of data...Ch. 1.3 - Prob. 8ECh. 1.3 - Prob. 9ECh. 1.3 - Comparing Graphs A discrete variable can take on...Ch. 1.3 - Prob. 11ECh. 1.3 - Prob. 12ECh. 1.3 - Prob. 13ECh. 1.3 - Prob. 14ECh. 1.3 - Prob. 15ECh. 1.3 - Prob. 16ECh. 1.3 - Prob. 17ECh. 1.3 - Calcium Contents The calcium content (Ca)of a...Ch. 1.3 - Prob. 19ECh. 1.3 - Prob. 20ECh. 1.3 - Prob. 21ECh. 1.3 - Prob. 22ECh. 1.3 - Prob. 23ECh. 1.3 - Prob. 24ECh. 1.3 - American Presidents The following table lists the...Ch. 1.4 - Graphing Relative Frequency Histograms Construct a...Ch. 1.4 - Graphing Relative Frequency Histograms Construct a...Ch. 1.4 - Interpreting Relative Frequency Histograms Use the...Ch. 1.4 - Interpreting Relative Frequency Histograms Use the...Ch. 1.4 - Interpreting Relative Frequency Histograms Use the...Ch. 1.4 - Interpreting Relative Frequency Histograms Use the...Ch. 1.4 - Interpreting Relative Frequency Histograms Use the...Ch. 1.4 - Interpreting Relative Frequency Histograms Use the...Ch. 1.4 - Class Boundaries In Exercises 912, use the...Ch. 1.4 - Class Boundaries In Exercises 912, use the...Ch. 1.4 - Prob. 11ECh. 1.4 - Prob. 12ECh. 1.4 - Prob. 13ECh. 1.4 - Prob. 14ECh. 1.4 - Relative Frequency Histogram I Construct a...Ch. 1.4 - Prob. 16ECh. 1.4 - Prob. 17ECh. 1.4 - Prob. 18ECh. 1.4 - Prob. 19ECh. 1.4 - Prob. 20ECh. 1.4 - Prob. 21ECh. 1.4 - Prob. 22ECh. 1.4 - Prob. 23ECh. 1.4 - Prob. 24ECh. 1.4 - A Recurring Illness The length of time (in months)...Ch. 1.4 - Prob. 26ECh. 1.4 - Prob. 27ECh. 1.4 - Prob. 28ECh. 1.4 - Prob. 29ECh. 1.4 - Prob. 30ECh. 1.4 - Prob. 31ECh. 1.4 - Student Heights The self-reported heights of 105...Ch. 1.4 - Prob. 33ECh. 1 - Quantitative or Qualitative? Identify each...Ch. 1 - Symmetric or Skewed? Do you expect the...Ch. 1 - Continuous or Discrete? Identify each variable as...Ch. 1 - Continuous or Discrete, again Identify each...Ch. 1 - World Lakes A lake is a body of water surrounded...Ch. 1 - Prob. 6RWYLCh. 1 - Election Results The 2016 election was a race in...Ch. 1 - Prob. 8RWYLCh. 1 - Prob. 9RWYLCh. 1 - Pulse Rates A group of 50 biomedical students...Ch. 1 - Prob. 11RWYLCh. 1 - Prob. 12RWYLCh. 1 - Gasoline Tax The following are the 2017 state...Ch. 1 - Prob. 14RWYLCh. 1 - Prob. 15RWYLCh. 1 - Prob. 16RWYLCh. 1 - Kentucky Derby The following data set shows the...Ch. 1 - Prob. 18RWYLCh. 1 - Old Faithful The following data are the waiting...Ch. 1 - Prob. 20RWYLCh. 1 - Prob. 1CSCh. 1 - Prob. 2CS
Knowledge Booster


Learn more about
Need a deep-dive on the concept behind this application? Look no further. Learn more about this topic, statistics and related others by exploring similar questions and additional content below.Similar questions
- F Make a box plot from the five-number summary: 100, 105, 120, 135, 140. harrow_forward14 Is the standard deviation affected by skewed data? If so, how? foldarrow_forwardFrequency 15 Suppose that your friend believes his gambling partner plays with a loaded die (not fair). He shows you a graph of the outcomes of the games played with this die (see the following figure). Based on this graph, do you agree with this person? Why or why not? 65 Single Die Outcomes: Graph 1 60 55 50 45 40 1 2 3 4 Outcome 55 6arrow_forward
- lie y H 16 The first month's telephone bills for new customers of a certain phone company are shown in the following figure. The histogram showing the bills is misleading, however. Explain why, and suggest a solution. Frequency 140 120 100 80 60 40 20 0 0 20 40 60 80 Telephone Bill ($) 100 120arrow_forward25 ptical rule applies because t Does the empirical rule apply to the data set shown in the following figure? Explain. 2 6 5 Frequency 3 сл 2 1 0 2 4 6 8 00arrow_forward24 Line graphs typically connect the dots that represent the data values over time. If the time increments between the dots are large, explain why the line graph can be somewhat misleading.arrow_forward
- 17 Make a box plot from the five-number summary: 3, 4, 7, 16, 17. 992) waarrow_forward12 10 - 8 6 4 29 0 Interpret the shape, center and spread of the following box plot. brill smo slob.nl bagharrow_forwardSuppose that a driver's test has a mean score of 7 (out of 10 points) and standard deviation 0.5. a. Explain why you can reasonably assume that the data set of the test scores is mound-shaped. b. For the drivers taking this particular test, where should 68 percent of them score? c. Where should 95 percent of them score? d. Where should 99.7 percent of them score? Sarrow_forward
- 13 Can the mean of a data set be higher than most of the values in the set? If so, how? Can the median of a set be higher than most of the values? If so, how? srit to estaarrow_forwardA random variable X takes values 0 and 1 with probabilities q and p, respectively, with q+p=1. find the moment generating function of X and show that all the moments about the origin equal p. (Note- Please include as much detailed solution/steps in the solution to understand, Thank you!)arrow_forward1 (Expected Shortfall) Suppose the price of an asset Pt follows a normal random walk, i.e., Pt = Po+r₁ + ... + rt with r₁, r2,... being IID N(μ, o²). Po+r1+. ⚫ Suppose the VaR of rt is VaRq(rt) at level q, find the VaR of the price in T days, i.e., VaRq(Pt – Pt–T). - • If ESq(rt) = A, find ES₁(Pt – Pt–T).arrow_forward
arrow_back_ios
SEE MORE QUESTIONS
arrow_forward_ios
Recommended textbooks for you
 Holt Mcdougal Larson Pre-algebra: Student Edition...AlgebraISBN:9780547587776Author:HOLT MCDOUGALPublisher:HOLT MCDOUGAL
 Glencoe Algebra 1, Student Edition, 9780079039897...AlgebraISBN:9780079039897Author:CarterPublisher:McGraw Hill
 Elementary Geometry For College Students, 7eGeometryISBN:9781337614085Author:Alexander, Daniel C.; Koeberlein, Geralyn M.Publisher:Cengage,
 Algebra: Structure And Method, Book 1AlgebraISBN:9780395977224Author:Richard G. Brown, Mary P. Dolciani, Robert H. Sorgenfrey, William L. ColePublisher:McDougal Littell
Holt Mcdougal Larson Pre-algebra: Student Edition...
Algebra
ISBN:9780547587776
Author:HOLT MCDOUGAL
Publisher:HOLT MCDOUGAL
Glencoe Algebra 1, Student Edition, 9780079039897...
Algebra
ISBN:9780079039897
Author:Carter
Publisher:McGraw Hill
Elementary Geometry For College Students, 7e
Geometry
ISBN:9781337614085
Author:Alexander, Daniel C.; Koeberlein, Geralyn M.
Publisher:Cengage,
Algebra: Structure And Method, Book 1
Algebra
ISBN:9780395977224
Author:Richard G. Brown, Mary P. Dolciani, Robert H. Sorgenfrey, William L. Cole
Publisher:McDougal Littell
How to make Frequency Distribution Table / Tally Marks and Frequency Distribution Table; Author: Reenu Math;https://www.youtube.com/watch?v=i_A6RiE8tLE;License: Standard YouTube License, CC-BY
Frequency distribution table in statistics; Author: Math and Science;https://www.youtube.com/watch?v=T7KYO76DoOE;License: Standard YouTube License, CC-BY
Frequency Distribution Table for Grouped/Continuous data | Math Dot Com; Author: Maths dotcom;https://www.youtube.com/watch?v=ErnccbXQOPY;License: Standard Youtube License