
Introduction To Probability And Statistics
15th Edition
ISBN: 9781337554428
Author: Mendenhall, William.
Publisher: Cengage Learning,
expand_more
expand_more
format_list_bulleted
Videos
Textbook Question
Chapter 1, Problem 17RWYL
Kentucky Derby The following data set shows the winning times (in seconds) for the Kentucky Derby races from 1950 to 2017.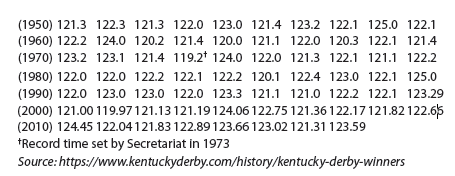
a. Do you think there will be a trend in the winning times over the years? Draw a line chart to verify your answer.
b. Use a graph to describe the distribution of winning times. Comment on the shape of the distribution and look for any unusual times.
Expert Solution & Answer

Trending nowThis is a popular solution!

Students have asked these similar questions
We consider the one-period model studied in class as an example. Namely, we assumethat the current stock price is S0 = 10. At time T, the stock has either moved up toSt = 12 (with probability p = 0.6) or down towards St = 8 (with probability 1−p = 0.4).We consider a call option on this stock with maturity T and strike price K = 10. Theinterest rate on the money market is zero.As in class, we assume that you, as a customer, are willing to buy the call option on100 shares of stock for $120. The investor, who sold you the option, can adopt one of thefollowing strategies: Strategy 1: (seen in class) Buy 50 shares of stock and borrow $380. Strategy 2: Buy 55 shares of stock and borrow $430. Strategy 3: Buy 60 shares of stock and borrow $480. Strategy 4: Buy 40 shares of stock and borrow $280.(a) For each of strategies 2-4, describe the value of the investor’s portfolio at time 0,and at time T for each possible movement of the stock.(b) For each of strategies 2-4, does the investor have…
Negate the following compound statement using De Morgans's laws.
Negate the following compound statement using De Morgans's laws.
Chapter 1 Solutions
Introduction To Probability And Statistics
Ch. 1.1 - Experimental UnitsDefine the experimental units...Ch. 1.1 - Experimental UnitsDefine the experimental units...Ch. 1.1 - Experimental UnitsDefine the experimental units...Ch. 1.1 - Experimental UnitsDefine the experimental units...Ch. 1.1 - Experimental UnitsDefine the experimental units...Ch. 1.1 - Qualitative or Quantitative? Are the variables in...Ch. 1.1 - Qualitative or Quantitative? Are the variables in...Ch. 1.1 - Qualitative or Quantitative? Are the variables in...Ch. 1.1 - Qualitative or Quantitative? Are the variables in...Ch. 1.1 - Discrete or Continuous? Are the variables in...
Ch. 1.1 - Discrete or Continuous? Are the variables in...Ch. 1.1 - Discrete or Continuous? Are the variables in...Ch. 1.1 - Discrete or Continuous? Are the variables in...Ch. 1.1 - Discrete or Continuous? Are the variables in...Ch. 1.1 - Discrete or Continuous? Are the variables in...Ch. 1.1 - Discrete or Continuous? Are the variables in...Ch. 1.1 - Discrete or Continuous? Are the variables in...Ch. 1.1 - Discrete or Continuous? Are the variables in...Ch. 1.1 - Populations or Samples? In Exercises 1922,...Ch. 1.1 - Populations or Samples? In Exercises 1922,...Ch. 1.1 - Populations or Samples? In Exercises 1922,...Ch. 1.1 - Populations or Samples? In Exercises 1922,...Ch. 1.1 - Parking on Campus Six vehicles selected from a...Ch. 1.1 - Past U.S. Presidents A data set gives the ages at...Ch. 1.1 - Voter Attitudes You are a candidate for your state...Ch. 1.1 - Cancer Survival Times A researcher wants to...Ch. 1.1 - New Teaching Methods A researcher wants to know...Ch. 1.2 - Pie and Bar Charts The data in Exercises 13...Ch. 1.2 - Pie and Bar Charts The data in Exercises 13...Ch. 1.2 - Pie and Bar Charts The data in Exercises 13...Ch. 1.2 - Groups of People Fifty people are grouped into...Ch. 1.2 - Presidential Popularity After the elections of...Ch. 1.2 - Presidential Popularity After the elections of...Ch. 1.2 - Presidential Popularity After the elections of...Ch. 1.2 - Presidential Popularity After the elections of...Ch. 1.2 - Presidential Popularity After the elections of...Ch. 1.2 - Prob. 10ECh. 1.2 - Prob. 11ECh. 1.2 - Prob. 12ECh. 1.2 - Prob. 13ECh. 1.2 - Prob. 14ECh. 1.2 - Prob. 15ECh. 1.2 - Back to Work How long does it take you to adjust...Ch. 1.2 - Prob. 17ECh. 1.2 - Prob. 18ECh. 1.2 - Prob. 19ECh. 1.2 - Prob. 20ECh. 1.2 - Prob. 21ECh. 1.3 - DotplotsConstruct a dotplot for the data given in...Ch. 1.3 - DotplotsConstruct a dotplot for the data given in...Ch. 1.3 - Stem and Leaf I Construct a stem and leaf plot for...Ch. 1.3 - Stem and Leaf I Construct a stem and leaf plot for...Ch. 1.3 - Stem and Leaf I Construct a stem and leaf plot for...Ch. 1.3 - Stem and Leaf II Use the following set of data...Ch. 1.3 - Stem and Leaf II Use the following set of data...Ch. 1.3 - Prob. 8ECh. 1.3 - Prob. 9ECh. 1.3 - Comparing Graphs A discrete variable can take on...Ch. 1.3 - Prob. 11ECh. 1.3 - Prob. 12ECh. 1.3 - Prob. 13ECh. 1.3 - Prob. 14ECh. 1.3 - Prob. 15ECh. 1.3 - Prob. 16ECh. 1.3 - Prob. 17ECh. 1.3 - Calcium Contents The calcium content (Ca)of a...Ch. 1.3 - Prob. 19ECh. 1.3 - Prob. 20ECh. 1.3 - Prob. 21ECh. 1.3 - Prob. 22ECh. 1.3 - Prob. 23ECh. 1.3 - Prob. 24ECh. 1.3 - American Presidents The following table lists the...Ch. 1.4 - Graphing Relative Frequency Histograms Construct a...Ch. 1.4 - Graphing Relative Frequency Histograms Construct a...Ch. 1.4 - Interpreting Relative Frequency Histograms Use the...Ch. 1.4 - Interpreting Relative Frequency Histograms Use the...Ch. 1.4 - Interpreting Relative Frequency Histograms Use the...Ch. 1.4 - Interpreting Relative Frequency Histograms Use the...Ch. 1.4 - Interpreting Relative Frequency Histograms Use the...Ch. 1.4 - Interpreting Relative Frequency Histograms Use the...Ch. 1.4 - Class Boundaries In Exercises 912, use the...Ch. 1.4 - Class Boundaries In Exercises 912, use the...Ch. 1.4 - Prob. 11ECh. 1.4 - Prob. 12ECh. 1.4 - Prob. 13ECh. 1.4 - Prob. 14ECh. 1.4 - Relative Frequency Histogram I Construct a...Ch. 1.4 - Prob. 16ECh. 1.4 - Prob. 17ECh. 1.4 - Prob. 18ECh. 1.4 - Prob. 19ECh. 1.4 - Prob. 20ECh. 1.4 - Prob. 21ECh. 1.4 - Prob. 22ECh. 1.4 - Prob. 23ECh. 1.4 - Prob. 24ECh. 1.4 - A Recurring Illness The length of time (in months)...Ch. 1.4 - Prob. 26ECh. 1.4 - Prob. 27ECh. 1.4 - Prob. 28ECh. 1.4 - Prob. 29ECh. 1.4 - Prob. 30ECh. 1.4 - Prob. 31ECh. 1.4 - Student Heights The self-reported heights of 105...Ch. 1.4 - Prob. 33ECh. 1 - Quantitative or Qualitative? Identify each...Ch. 1 - Symmetric or Skewed? Do you expect the...Ch. 1 - Continuous or Discrete? Identify each variable as...Ch. 1 - Continuous or Discrete, again Identify each...Ch. 1 - World Lakes A lake is a body of water surrounded...Ch. 1 - Prob. 6RWYLCh. 1 - Election Results The 2016 election was a race in...Ch. 1 - Prob. 8RWYLCh. 1 - Prob. 9RWYLCh. 1 - Pulse Rates A group of 50 biomedical students...Ch. 1 - Prob. 11RWYLCh. 1 - Prob. 12RWYLCh. 1 - Gasoline Tax The following are the 2017 state...Ch. 1 - Prob. 14RWYLCh. 1 - Prob. 15RWYLCh. 1 - Prob. 16RWYLCh. 1 - Kentucky Derby The following data set shows the...Ch. 1 - Prob. 18RWYLCh. 1 - Old Faithful The following data are the waiting...Ch. 1 - Prob. 20RWYLCh. 1 - Prob. 1CSCh. 1 - Prob. 2CS
Knowledge Booster


Learn more about
Need a deep-dive on the concept behind this application? Look no further. Learn more about this topic, statistics and related others by exploring similar questions and additional content below.Similar questions
- Question 6: Negate the following compound statements, using De Morgan's laws. A) If Alberta was under water entirely then there should be no fossil of mammals.arrow_forwardNegate the following compound statement using De Morgans's laws.arrow_forwardCharacterize (with proof) all connected graphs that contain no even cycles in terms oftheir blocks.arrow_forward
- Let G be a connected graph that does not have P4 or C3 as an induced subgraph (i.e.,G is P4, C3 free). Prove that G is a complete bipartite grapharrow_forwardProve sufficiency of the condition for a graph to be bipartite that is, prove that if G hasno odd cycles then G is bipartite as follows:Assume that the statement is false and that G is an edge minimal counterexample. That is, Gsatisfies the conditions and is not bipartite but G − e is bipartite for any edge e. (Note thatthis is essentially induction, just using different terminology.) What does minimality say aboutconnectivity of G? Can G − e be disconnected? Explain why if there is an edge between twovertices in the same part of a bipartition of G − e then there is an odd cyclearrow_forwardLet G be a connected graph that does not have P4 or C4 as an induced subgraph (i.e.,G is P4, C4 free). Prove that G has a vertex adjacent to all othersarrow_forward
- We consider a one-period market with the following properties: the current stock priceis S0 = 4. At time T = 1 year, the stock has either moved up to S1 = 8 (with probability0.7) or down towards S1 = 2 (with probability 0.3). We consider a call option on thisstock with maturity T = 1 and strike price K = 5. The interest rate on the money marketis 25% yearly.(a) Find the replicating portfolio (φ, ψ) corresponding to this call option.(b) Find the risk-neutral (no-arbitrage) price of this call option.(c) We now consider a put option with maturity T = 1 and strike price K = 3 onthe same market. Find the risk-neutral price of this put option. Reminder: A putoption gives you the right to sell the stock for the strike price K.1(d) An investor with initial capital X0 = 0 wants to invest on this market. He buysα shares of the stock (or sells them if α is negative) and buys β call options (orsells them is β is negative). He invests the cash balance on the money market (orborrows if the amount is…arrow_forwardDetermine if the two statements are equivalent using a truth tablearrow_forwardQuestion 4: Determine if pair of statements A and B are equivalent or not, using truth table. A. (~qp)^~q в. р л~9arrow_forward
- Determine if the two statements are equalivalent using a truth tablearrow_forwardQuestion 3: p and q represent the following simple statements. p: Calgary is the capital of Alberta. A) Determine the value of each simple statement p and q. B) Then, without truth table, determine the va q: Alberta is a province of Canada. for each following compound statement below. pvq р^~q ~рл~q ~q→ p ~P~q Pq b~ (d~ ← b~) d~ (b~ v d) 0 4arrow_forward2. Let X be a random variable. (a) Show that, if E X2 = 1 and E X4arrow_forwardarrow_back_iosSEE MORE QUESTIONSarrow_forward_ios
Recommended textbooks for you
 Big Ideas Math A Bridge To Success Algebra 1: Stu...AlgebraISBN:9781680331141Author:HOUGHTON MIFFLIN HARCOURTPublisher:Houghton Mifflin Harcourt
 Glencoe Algebra 1, Student Edition, 9780079039897...AlgebraISBN:9780079039897Author:CarterPublisher:McGraw Hill
 Holt Mcdougal Larson Pre-algebra: Student Edition...AlgebraISBN:9780547587776Author:HOLT MCDOUGALPublisher:HOLT MCDOUGAL
Big Ideas Math A Bridge To Success Algebra 1: Stu...
Algebra
ISBN:9781680331141
Author:HOUGHTON MIFFLIN HARCOURT
Publisher:Houghton Mifflin Harcourt
Glencoe Algebra 1, Student Edition, 9780079039897...
Algebra
ISBN:9780079039897
Author:Carter
Publisher:McGraw Hill
Holt Mcdougal Larson Pre-algebra: Student Edition...
Algebra
ISBN:9780547587776
Author:HOLT MCDOUGAL
Publisher:HOLT MCDOUGAL
How to make Frequency Distribution Table / Tally Marks and Frequency Distribution Table; Author: Reenu Math;https://www.youtube.com/watch?v=i_A6RiE8tLE;License: Standard YouTube License, CC-BY
Frequency distribution table in statistics; Author: Math and Science;https://www.youtube.com/watch?v=T7KYO76DoOE;License: Standard YouTube License, CC-BY
Frequency Distribution Table for Grouped/Continuous data | Math Dot Com; Author: Maths dotcom;https://www.youtube.com/watch?v=ErnccbXQOPY;License: Standard Youtube License